February 4, 2020
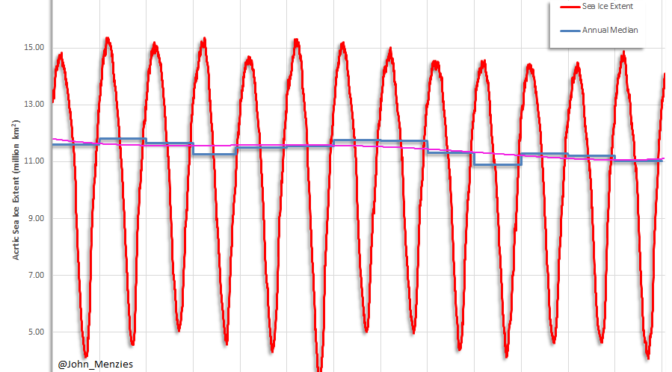
The Arctic sea ice extent is within 1 SD of the 1979-2019 mean and the highest since 2009 on this day. It is no surprise that this remains unreported in media. A plot of the sea extent time series from 2007 to 2020 shows no significant trend and lacks any evidence for a crisis in the Arctic.
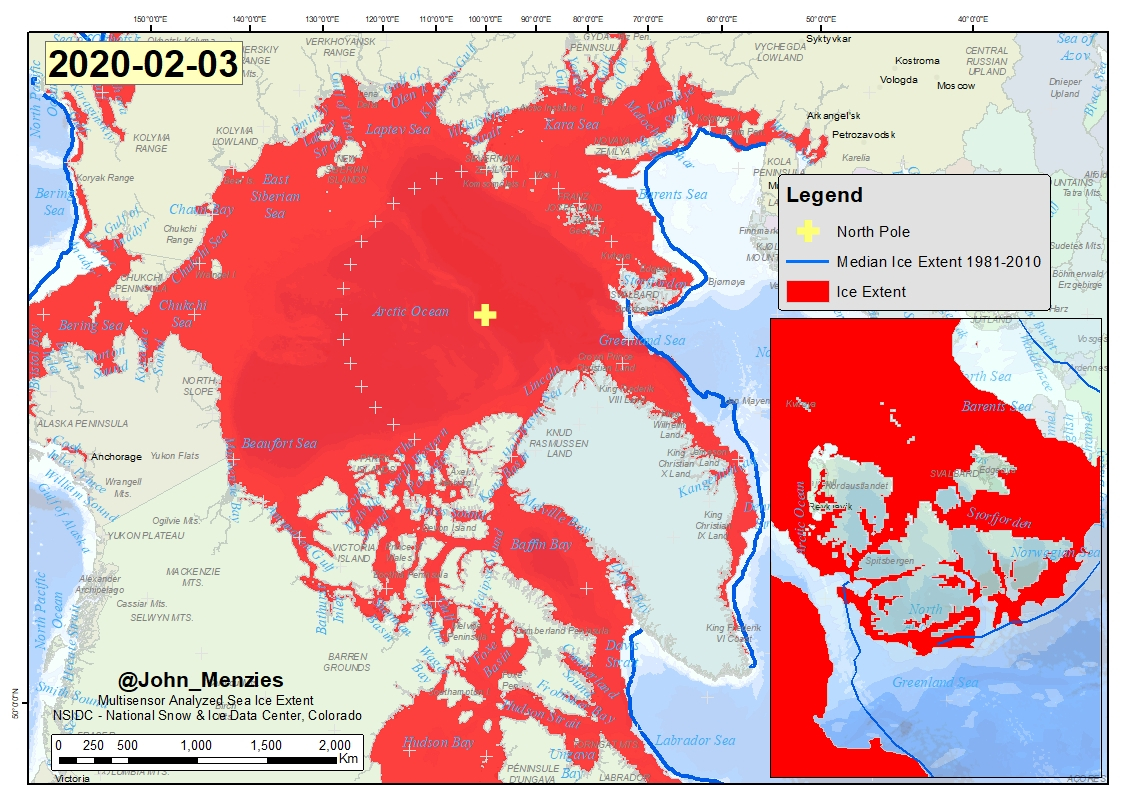
Mapped Arctic sea ice extent (SIE) on 02/02/2020 was 14.42 million km2 which is 370,000 km2 or 2.5% less than the 1979-2019 average. This is largest sea ice extent on this day since 2009 and is within 1 SD of the 1979-2019 mean ice extent.
The average sea ice accumulation rate in the last 5 days is 55,000 km2/day. The 2019-2020 winter rate of sea ice accumulation is amongst the highest on record and sea ice extent, volume and thickness are not expected to peak until March, 2020.


The daily sea ice extent data for February for the period of available data from 1979 to 2020 is shown above. The current sea ice extent is well within the 1 SD of the 1979-2019 average and is the highest since 2009. Arctic sea ice extent shows little trend since 2010.
Arctic sea ice extent is not expected to peak until March 2020.

What can be concluded is that the Arctic is not disappearing and that there is little evidence to support the endless claims over the decades that the Arctic sea ice will vanish during a coming summer. While CO2 has increased during this period sea ice extent has failed to decline as predicted. Where is the crisis in the Arctic as there seems to be no relationship between atmospheric CO2 and Arctic ice extent, volume or thickness (see earlier posts)?
The extent of Arctic sea ice varies from summer to winter. The sea ice extent shown here relies on data from the Multisensor Snow and Ice Mapping System (IMS) that runs at the National Ice Centre. The IMS product uses several satellite data sources including passive microwave, but it is also based on visual analysis and other data sources and undergoes a form of manual data fusion. The data reported here has a 1 km resolution and was sourced from the National Snow and Ice Data Centre
