Ben Andrew, Senior Geologist at Mt Isa Mines submitted a captivating PhD thesis (Andrews, B.S., 2020) in 2020 on alteration at Mt Isa and its implications for fluid flow of the hydrothermal fluid that formed the world class Cu and Pb-Zn-Ag orebodies. Here we summarize some of his δ18O results.
Introduction
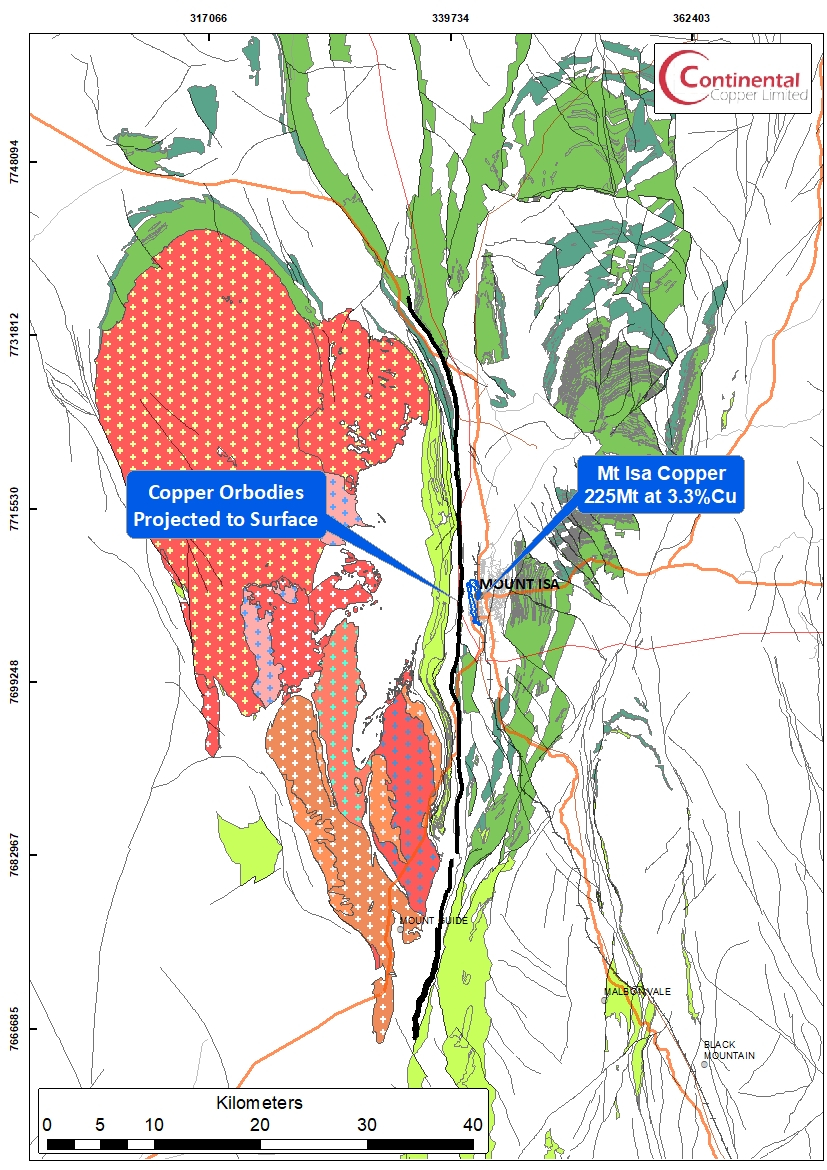
The Mount Isa Pb-Zn-Ag and Cu deposit are situated in Northwest Queensland, specifically within the Mount Isa Inlier, a geological region that encompasses one of the most extensive areas of Proterozoic crust preserved in the Australian continent, covering approximately 61,000 square kilometers.
The deposit itself comprises copper mineralization hosted within veins and breccias, along with strata-bound lenses of lead, zinc, and silver mineralization arranged in an en-echelon fashion. These distinct orebodies are spatially associated but remain independent.
Prior to any mining activities, the deposit was estimated to contain substantial resources, with 255 million tonnes at 3.3% copper, and 150 million tonnes at 7% zinc, 6% lead, and 150 grams per ton of silver.
Moreover, the Isa valley, delineated as the Leichardt River catchment area upstream of Lake Moondarra, is home to other world-class Pb-Zn-Ag deposits at George Fisher and Hilton. These deposits also exhibit some copper mineralization of sub-economic significance. Notably, all economic base metal mineralization discovered within the Isa valley is confined within the Urquhart Shale, a geological formation characterized by its carbonaceous, dolomitic, siltstone, and shale within the Mount Isa Group.
The Mount Isa deposits have been under continuous mining operations since their discovery in 1923 and have a rich history of extensive research efforts. However, the enduring geological debate concerning Mount Isa revolves around the fact that a single mine yields low-copper ore from an enormous stratiform lead-zinc deposit, alongside low-lead-zinc ores from a world-class breccia-hosted copper deposit, all occurring within a remarkably small area of less than 1 km in both vertical and horizontal dimensions.
This distinctive spatial association of world-class base metal deposits has generated significant contention regarding the genetic model of the Mount Isa Pb-Zn-Ag and Cu deposits. Specifically, there has been ongoing controversy regarding the timing of the formation of the two deposits and whether the orebodies are syngenetic (formed during sedimentation) or epigenetic (formed during later deformation).
Oxygen Isotope Study
In 2020, Andrews conducted a comprehensive investigation of the extensive isotopic alteration linked to copper mineralization at Mount Isa. This research extended previous isotopic studies and exploration initiatives by constructing a three-dimensional spatial interpolation of stable carbon and oxygen isotope data. It involved a comparison of outcomes obtained from one-dimensional reactive transport models with δ18O alteration patterns observed at Mount Isa. The primary goal was to gain insights into the hydrothermal fluid flow patterns within the system, including the identification of fluid flow pathways and fluid input zones.
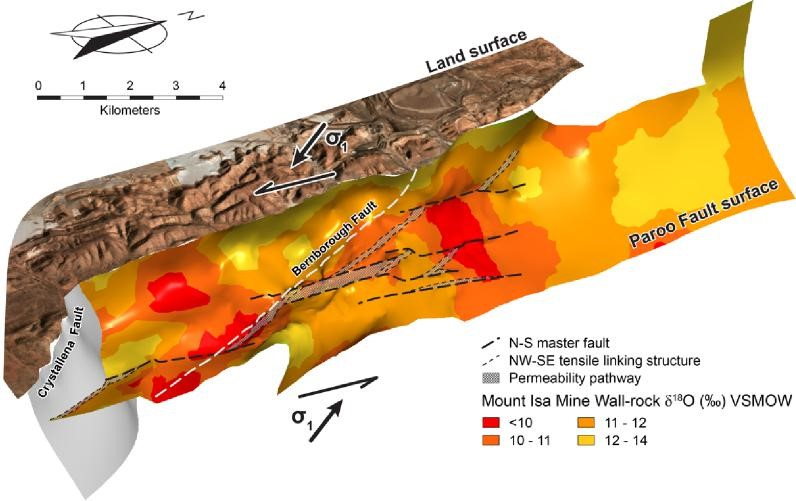
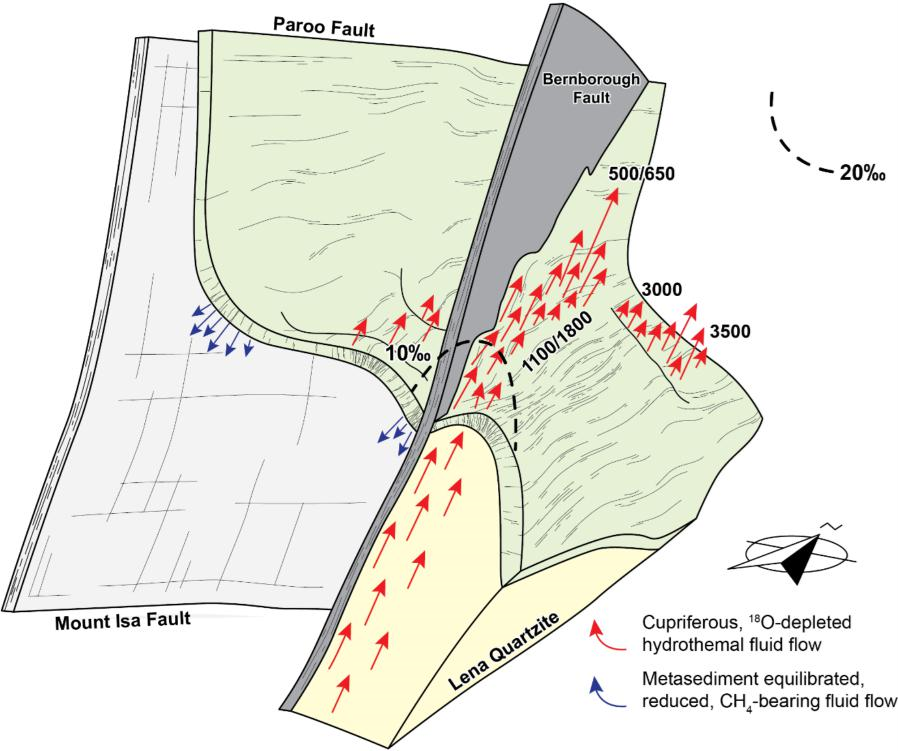
Andrews, 2020 interpolated the δ18O and reports a number of plans and sections. Previous studies have inferred that the Paroo Fault played a critical role in focusing hydrothermal fluid flow during the deposition of copper mineralization. The most compelling representation of the data is a 3D view of the δ18O value interpolation using the Paroo Fault as a reference surface (see image above).
This reveals that there is a nested set of isotope surfaces with consistent spatial variations. It reveals that all the rock formation in the hanging-wall of the Paroo Fault exhibit δ18O values below 14‰. However, the above figure shows discrete, coherent zones of carbonate rocks with δ18O values less than 10‰. These zones are oriented along NW-SE and N-S trends that extend a maximum length of 1500 m. A zone with δ18O values between 10 and 11‰ confirms these trends and highlights a further subtle NE-SW trend. Both NW-SE and NE-SW trends broadly transgress the stratigraphy of the Mount Isa Group, which predominantly strikes N-S within the Isa valley.
Andrews, 2020 concludes that mapping δ18O values on the Paroo Fault identifies zones of δ18O -depletion associated with fluid input zones. Zones of intense δ18O -depletion coincide with the axis of D3 folds in the basement contact and basement lineaments that potentially dilated during NW-SE directed, D4 compression, both of which are proposed to have focused fluid flow from basement rocks to sites of copper mineralization in metasediments.
Fluid Flow Model
Andrews, 2020 suggests that large-scale patterns of oxygen isotope alteration in carbonates at Mount Isa can be explained by propagation of a δ18O reaction front during the infiltration of isotopically light fluid into unaltered metasediments of the Mount Isa Group and progressive isotopic exchange between these two oxygen reservoirs.
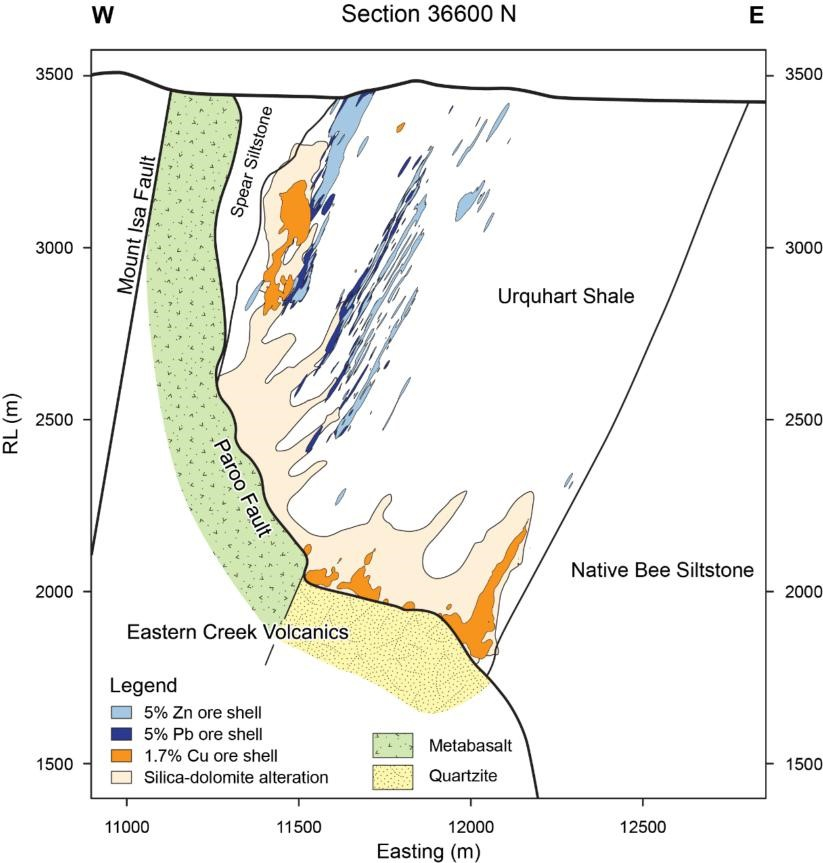
Reactive transport theory dictates that the fluid buffered region of the hydrothermal system is located upstream of the reaction front, adjacent to the start of the fluid flow pathways. As such, Andrew, 2020 interprets the fluid flow responsible for δ18O depletion in carbonate rocks at Mount Isa to have occurred in a predominantly upward direction from the Paroo Fault and that the data precludes south to north directed flow of hydrothermal fluids. Further, zones of intense δ18O depletion are closely associated with copper mineralisation adjacent to the Paroo Fault and δ18O values less than 10‰ around 37,000 mN strongly suggest the 3500-copper orebody sits adjacent to a fluid inlet.
δ18O values also suggest that fluid flow from the underlying basement rocks toward sites of mineralization in the overlying metasediments is concentrated in the area extending from the center of the 1100 orebody towards the SSE, likely attributed to the Bernborough Fault. Additionally, the formation of other orebodies is believed to have been influenced by various structural features, such as zones of dilation within the hinge of NE-trending D3 folds along the basement contact and N-S striking master faults and tensile linking structures. It is also suggested that zones of dilation beneath synformal inflections on the basement contact may have facilitated the downward movement of metasediment-equilibrated fluids into the underlying Eastern Creek Volcanics.
Reference
Andrew, B.S., 2020, Recognizing cryptic alteration surrounding the Mount Isa Copper Deposits: implications for controls on fluid flow, and mineral exploration, PhD Thesis, University of Waikato.