Category Archives: Science

If you liked “Walk Like an Egyptian” – You will love “Eating Like an Aboriginal”

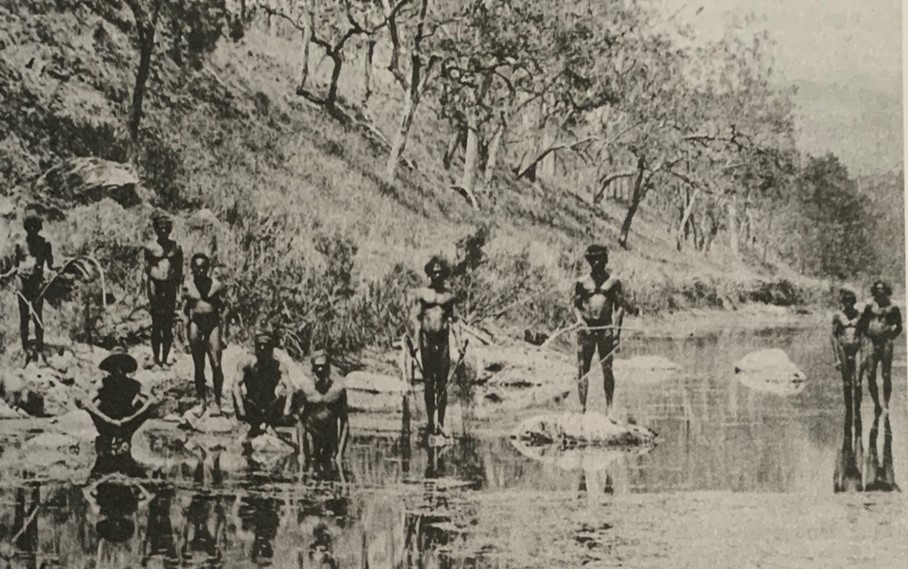
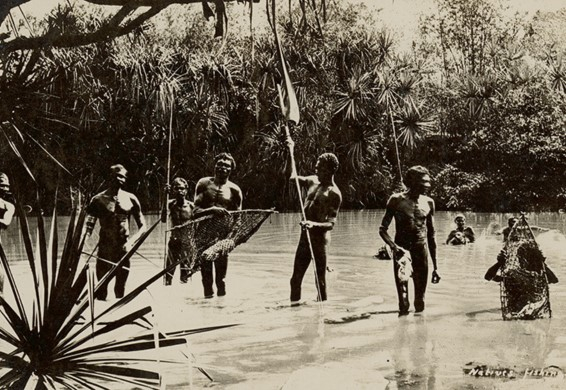
Australian Aboriginals were hunter gatherers surviving on “Bush Tucker” and photographs of traditional tribal groups in the 1800s showed that they were impressive muscular, toned and very lean. 

The Aboriginal diet consisted of upwards of 6,000 indigenous herbs (Eastwood, 2012), spices, vegetables, animals, birds, reptiles, insects, fruits and flowers (Mooney, 2015). Flora that was consumed in the Indigenous diet included seeds, peppers, fruits, citrus, berries, and more. Mountain pepper, bush tomatoes, muntries, lemon myrtle, wattle-seed, native pepper- berries, native mint and honey are just some of the native flora that gave flavour to Indigenous food (Eastwood, 2012).

The main source of protein was the abundance and varied Australia wildlife including  Kangaroos, Wild Turkeys, Possums, Emus, Anteaters, Lizards and Snakes and fish and shellfish along the coast and in rivers.

Brisbane River Indigenous inhabitants, 1890’s. Source: John Oxley Library

For 40,000-50,000 years, plants played a supplementary role in the diet of Australian Aboriginal (AA) hunter-gatherers. Recent insights into nutrient composition and physiological effects of AA foods contribute to the debate on the ‘prudent’ diet and human evolution. A 1998 study by Brand-Miller and Holt evaluated over 800 Aboriginal plant foods, comparing them with modern cultivated foods, to determine their contribution to traditional AA diets. A typical in a 12500 kJ/3000 kcal diet was characterized as follows.

  • Energy Contribution from Plants (20-40%):
    • Protein: 22-44 g
    • Fat: 18-36 g
    • Carbohydrate: 101-202 g
    • Fiber: 40-80 g
    • Vitamin C: 90-180 mg
  • Composition of the Traditional AA Diet:
    • Low in carbohydrates, especially starch
    • High in dietary fiber
  • Carbohydrate Sources:
    • Over half from sugars derived from fruit and honey
  • Low Glycemic Index:
    • Traditional Carbohydrate foods had a low glycemic index
    • Resulting in a relatively low demand for insulin secretion
  • Potential Protective Effect:
    • Low demand for insulin secretion may have protected AA from genetic predisposition to insulin resistance.
    • Potential prevention of consequences like non-insulin-dependent diabetes mellitus, coronary heart disease, and obesity.
  • Dietary Pattern and Lifestyle:
    • The dietary pattern and active lifestyle of recent hunter-gatherers like AA could serve as a reference standard for modern human nutrition.
    • It may act as a model for defense against diseases of affluence.

Australian Aboriginal Model Diet

While there is little nutritional information on traditional foods, I have created a diet model based upon Kangaroo and insect meats, seeds and berries. It consists of 450g of roast kangaroo, 50g of Witchetty Grubs, 325g of seeds and 250g of berries for a target caloric intake of ~3,000 kCal reflecting an active lifestyle using 50% of BMI calories. This results in a diet consisting by caloric intake of 30% protein, 22% carbs and 48% fat with more than 100g of fiber. On this basis and considering their active lifestyle they would have been very healthy with intentional and unintentional injury being the major health risks.

Below is the dietary model for the Australian Aboriginal before the arrival of Europeans.

Powered By EmbedPress

Australian Aboriginals may have adapted over a long period of time to a low GI diet resulting in efficient and sparing insulin production.  Many Australian Aboriginals now suffer from the health effects of a high carbohydrate diet and diabetes has become a serious issue. It is possible that they are now genetically predisposed to excessive insulin production from a diet which is high in refined carbohydrates. 

Interestingly many in the west are now pursing not dissimilar  low GI diets but likely with significantly less fibre.  I suspect that cancer rates in Australian Aboriginals were likely very low before the arrival of Europeans. 

Australian Aboriginals: Source Unknown Circa 1890s

Eastwood, R. (2012). Australian Cookbook- Outback Bushtucker (pp. 1-5). Wingback Books.

AN AI VIEW ON QUANTUM ENTANGLEMENT AND BLACK HOLES

Seen nearly edgewise, the turbulent disk of gas churning around a black hole takes on a crazy double-humped appearance. The black hole’s extreme gravity alters the paths of light coming from different parts of the disk, producing the warped image. The black hole’s extreme gravitational field redirects and distorts light coming from different parts of the disk, but exactly what we see depends on our viewing angle. The greatest distortion occurs when viewing the system nearly edgewise.
Credits: NASA’s Goddard Space Flight Center/Jeremy Schnittman
Download this and related multimedia from NASA Goddard’s Scientific Visualization Studio

I recently had a chat with the Artificial Intelligence application, ChatGPT. ChatGPT (Generative Pre-trained Transformer) is a chatbot launched by OpenAI in November 2022. It is built on top of OpenAI’s GPT-3 family of large language models, and is fine-tuned (an approach to transfer learning) with both supervised and reinforcement learning techniques.

Continue reading AN AI VIEW ON QUANTUM ENTANGLEMENT AND BLACK HOLES

Novel Corona Virus Progression, Reported Rate of Transmission Continues to Slow 09/02/2020

Novel Corona Virus. Corona viruses take their name from their crown-like halo.Credit: EYE OF SCIENCE/SPL

While the Novel Corona Virus (nCOV2019) remains a serious global infection, the media continues to report on nCOV2019 with remarkable ignorance. The common journalistic refrain is now citing increasing numbers of cases with alarm claiming that the infection is accelerating. Based on the reported number of cases, for the moment, little could be further from reality. The reported rate of increase in cases has dropped significantly. With the extended Chinese New Year (CNY) holiday now coming to an end, transmission rates may well now increase as travel resumes. The progression of the disease both inside and outside of China looks remarkably similar excepting in Hubei where it had likely spread well before a new highly infectious virus was recognized. In Hubei the initial reported death rate was high, likely reflecting poor early reporting and a medical system inundated with a large number of cases requiring intensive care.

Progression of nCOV2019 symptomatic cases by Chinese province plus Rest of the World

The disease progression for the reported data for all the Chinese provinces and the Rest of the World is shown in the graphic above. The similarity in the slope of disease progression suggests that the data is internally consistent and that commonly discussed under-reporting may not be occurring. The straight-line trends on the log scale simply reflects the logarithmic nature of disease progression for a disease with Ro>1. The chaotic trends at the beginning of the record likely reflects delayed reporting and possibly increased presentation of cases as the public became more aware of the severity of the disease after the 21st January.

The chart below of the distribution of nCOV2019 cases shows that the majority of cases are reporting in Hebei and supports the decision by the Chinese Government to lockdown not only Wuhan but the entire province.

Distribution of nCOV2019 cases by location

As would be expected the distribution of mortalities is predominantly in Hubei province.

Distribution of reported nCOV2019 deaths by location

The aggregate mortality rate is shown in the chart below (note the inverted Y-axis). After an initial surge in deaths (which may reflect delayed reporting) in Hubei province the mortality rate has stabilised at 2%, however this average hides some interesting details.

Average calculated rate of mortality for all reported cases.

The Mortality Rate varies significantly by region. Mortality in Hubei province was the highest at nearly 3%. This likely reflects the rapid progression of the disease before the appearance of nCOV2019 was recognized and before enough resources could be mobilized. The data also suggests that provinces with better resourced medical facilities were better able to manage patient care. An example of this would be Guangdong compared with Gansu. Guangdong reported more than 10 times the cases of Gansu, however Guangdong reported a mortality rate of 0.9% compared with that of Gansu at 2.4%. There are a number of other comparable comparisons in the data all reflecting likely difference in medical infrastructure.

The mortality data for the rest of the world indicates a death rate of less than 1%. While this data still reflects the earliest days in the disease progression, a number of conclusions can be drawn. nCOV2019 is highly contagious resulting in both viral pneumonia and secondary bacterial pneumonia. A high proportion of patients require hospitalization and oxygen therapy at least for several days. This places considerable strain on these facilities and available oxygen supplies. Were a pandemic to evolve outside China and medical facilities were overwhelmed then comparable mortality to Hubei could be anticipated.

nCOV2019 cases and mortality for China and the Rest of the World

With the end of the CNY and the resumption of travel in china it would seem likely that case numbers may well increase significantly. It is however also likely that many people will stay away from the workplace and remain in the provinces and many businesses many simply close for some time, moderating the impact.

Controlling nCOV2019 both within China and outside will be very challenging, particulalry in countries with poor medical infrastructure. It would seem reasonable that in parts of SE Asia and in Africa nCOV2019 there is a high probability that nCOV2019 will reach pandemic levels. It is also possible that nCOV2019 may be with us for some time, presenting as an annual epidemic until there is sufficient immunity with the global community.

While various experts have commented that surgical masks offer no protection, I would suggest that they are highly effective in keeping hands away from faces, which is likely the main form of transmission. In addition, prudent and regular hand washing should be encouraged and governments should prepare for nCOV2019 by adequately resourcing medical services. It should be remembered that SARS and MERS are both more contagious and more deadly but were successfully contained.

Novel Corona Virus Progression, Reported Rate of Transmission is Slowing in China

Novel Corona Virus Progression, Some Observations

Coronaviruses take their name from their crown-like halo.Credit: EYE OF SCIENCE/SPL

We started to track the Novel Corona Virus (nCOV2019) back in mid-January and based on the reported statistics developed a model for disease transmission and mortality. The training period for the model is shown in blue below and the underlying parameters have not been changed. Assumptions included a reduction in transmission rates as a consequence of public health measures in the near term plus a reduction in mortality rates as treatment methodologies improved and ultimately the recognition that some of the more exotic anti-virals had some impact. At the time we considered the model to be optimistic.

nCOV2019 reported cases by Chinese province. Data: John Hopkins

The disease progression for the reported data for all the Chinese provinces is shown in the graphic above. What is obvious is the similar slope to all the case trends (at the same axis scale, Hubei has the same slope as other province). The straight line trends on the log scale simply reflects the logarithmic nature of disease progression for a disease with Ro>1. The chaotic trends at the beginning of the record likely reflects delayed reporting. While there has been some comment that epidemiological models predict, based on an Ro of 2.2, 10 times the number of cases, the Chinese reported data would appear to be internally consistent and we are inclined to believe the data, until proven otherwise.

nCOV2019 reported cases and deaths (Data: John Hopkins) and model progression.

Comparison of the reported cases and deaths to the model is revealing. While the mortality rate shows very modest decline the rate of transmission appears to be declining significantly likely in response to the remarkable Chinese public health measures. Progression of the disease in countries outside of China is as would be anticipated. It is surprising that there are no reported cases in Africa. Considering the state of African medical services if nCOV2019 were to become established, the impacts on the continent could be more significant than in China and elsewhere in terms of totals cases and mortality.

The nCOV2019 outbreak is far from over but there are some positive developments in China as is evident in the data. We should not underestimate, that while the disease likely originated from the consumption of bats, the Chinese public and medical profession have behaved heroically.

China will now likely reflect on its public health investment and importantly on the interaction between the public and wild animals. The risk of new novel viruses will not be reduced until the consumption of exotic animals, particulalry wild mammals, is better controlled.

Sol Gets a numbered sunspot

Near-Live image of the sun in 304 angstrom as seen by NASA’s SDO.

It has been a surprise in the last 12 months to see a numbered sunspot on the face of Sol, but we have one today in NOAA Active Region 2575 (Catania sunspot group 28). The sunspot is stable but inactive. This image is for that part of teh spectrum centred on 304 Angstroms where photons are emitted by Helium 2 at around 50,000C, in the chromosphere and the transition region. Solar activity is expected to remain low with a low probability of flares or mass ejections.

In the past 24 hours the solar wind speed remained slightly enhanced under the influence of a negative polarity coronal hole and increased from around 400 to 520 km/s. The total interplanetary magnetic field strength was in the range of within 5-8nT in the beginning of the period and has decreased to below 3nT at 12 UTC today. The Bz component was mostly negative with a minimum value of -7 nT. The solar wind conditions are expected to remain enhanced over the next 24 hours.

Sunspots on the face of our star remain few in number as we are in the middle of the solar minimum. Solar Cycle 25 will be the 25th Solar Cycle since 1755. Solar cycles are marked by a reversal in magnetic polarity, with the first convincingly reversed sunspots of SC 25 occuring in November 2019. SC 25 solar maximum should occur between 2023 and 2026 with 2031 seeing the end of the cycle. The strength of SC 25 is debated with predictions of 30-50% of SC24 to somewhat stronger than SC24.

There Is No Climate Emergency – Letter

With Global Warming protests and strikes held by student in a number of countries, a group of 500 scientists and other “professionals in climate and related fields” have written an open letter to the United Nations . In the letter, the signatories state that “climate science should be less political, while climate policies should be more scientific,” while also denouncing “the uncertainties and exaggerations in…predictions of global warming.” The text is reproduced below and the full letter available for download.

A polar bear in Repulse Bay, Nunavut Territory, Canada.
Paul Souders | Getty Images

There is no climate emergency

A global network of 500 scientists and professionals has prepared this urgent message. Climate science should be less political, while climate policies should be more scientific. Scientists should openly address the uncertainties and exaggerations in their predictions of global warming, while politicians should dispassionately count the real benefits as well as the imagined costs of adaptation to global warming, and the real costs as well as the imagined benefits of mitigation.

Natural as well as anthropogenic factors cause warming

The geological archive reveals that Earth’s climate has varied as long as the planet has existed, with natural cold and warm phases. The Little Ice Age ended as recently as 1850. Therefore, it is no surprise that we now are experiencing a period of warming.

Warming is far slower than predicted

The world has warmed at less than half the originally-predicted rate, and at less than half the rate to be expected on the basis of net anthropogenic forcing and radiative imbalance. It tells us that we are far from understanding climate change.

Climate policy relies on inadequate models

Climate models have many shortcomings and are not remotely plausible as policy tools. Moreover, they most likely exaggerate the effect of greenhouse gases such as CO2. In addition, they ignore the fact that enriching the atmosphere with CO2 is beneficial.

CO2 is plant food, the basis of all life on Earth

CO2 is not a pollutant. It is essential to all life on Earth. Photosynthesis is a blessing. More CO2 is beneficial for nature, greening the Earth: additional CO2 in the air has promoted growth in global plant biomass. It is also good for agriculture, increasing the yields of crops worldwide.

Global warming has not increased natural disasters

There is no statistical evidence that global warming is intensifying hurricanes, floods, droughts and suchlike natural disasters, or making them more frequent. However, CO2-mitigation measures are as damaging as they are costly. For instance, wind turbines kill birds and bats, and palm-oil plantations destroy the biodiversity of the rainforests.

Climate policy must respect scientific and economic realities

There is no climate emergency. Therefore, there is no cause for panic and alarm. We strongly oppose the harmful and unrealistic net-zero CO2 policy proposed for 2050. If better approaches emerge, we will have ample time to reflect and adapt. The aim of international policy should be to provide reliable and affordable energy at all times, and throughout the world.

ecd-letter-to-un

Galactic Colonization: A New Model

2D slice of 3D simulation of expansion of the Galactic Settlement front. Blue is unsettled, red is settled and green is targeted

Jonathan Carroll-Nellenback and partners have published a fine article in Astrophysical Journal on a modelling exercise on civilizational expansion across the Milky Way, addressing the Fermi Paradox. According to a study published last month in The Astronomical Journal, extraterrestrial life might be taking its time to fully explore the galaxy, even using the movement of star systems to make this type of journey easier.

The Fermi Paradox has a long history in discussions of the prevalence of “alien” technological civilizations (i.e. ‘exo-civilizations’) in the galaxy. Originating with a lunchtime conversation in 1950 where Enrico Fermi famously asked ‘where is ev­erybody?’, the Fermi paradox was first for­malized in 1975 and has since become a standard framework for addressing questions concerning the preva­lence of exo-civilizations. Formally the paradox might be expressed as follows: “If technologically advanced exo-
civilizations are common, then we should already have evidence of their existence either through direct or in­direct means”

Assuming amongst other things that any interstellar probe would have a minimum velocity of 30km/sec which would be achievable using gravity assist from large planets within 1 AU they reach a number of interesting conclusion:

  • When diffusive stellar motions are accounted for, they contribute to the Galaxy becoming fully set­tled in a time less than, or at very least comparable to its present age, even for slow or infrequent in­terstellar probes;
  • If a settlement front forms, all settleable systems behind it become “filled in” in a time less than the current age of the Galaxy;
  • While settlement wave crossing and fill-in times are short, consideration of finite civilization lifetimes in a steady state model allows for conditions in which the settled fraction is less than 1. Thus the galaxy may be in a steady state in which not every settleable system is currently settled.
  • Statistical fluctuations in local density of settleable systems allows for the formation of set­tlement clusters which can continually resettle one another. These clusters are then surrounded by large unsettled regions. If such conditions repre­sent the situation in our region of the galaxy and Earth was not in one of the ”re-settlement” clusters it would be highly probable that we would not have been settled (or visited) by another civilization for some time.
  • By consideration of the convolution of steady state solutions with geologic evidence horizons, it is pos­sible to find situations in which Earth may not have experienced a settlement event for longer than some horizon time (assumed to be 1 Myr) even though the galaxy supports a population of inter­stellar civilizations.

Even for slow probes (30 km/sec) they find that the upper limit of the galactic crossing times are just less than 1 Gyr. This is in accord with our modelling for the colonization of the Type A stars within 100 LY of Earth assuming 5 habitable planets amongst the 75 stars that meet this criteria. We estimated that dependent on probe speed would take between 350,000 and 900,000 years.

The authors discuss amongst other things the energy requirements for interstellar travel and suggest that this is a major impediment to the postulated wave of colonization. A multi-generational ship would they suggest require economies equivalent to that of entire solar systems. They consider a ‘medium multi-generational cruiser’ case . This would be a ship traveling at v = 0.05c, carrying a population of 104 people and weighing 107 tonnes. Such a ship would require a power of 6900 zettajoules (ZJ) funded by a solar sys­tem wide civilization of 900 billion people that would generate 1136 ZJ per year. The world presently produces around 1 ZJ Joule and this quantum of energy would require a significant civilizational commitment.

Download the Full Text

The Fermi Paradox and the Aurora Effect: Exo-civilization Settlement, Expansion and Steady States

Jonathan Carroll-NellenbackAdam FrankJason WrightCaleb Scharf(Submitted on 12 Feb 2019)

We model the settlement of the galaxy by space-faring civilizations in order to address issues related to the Fermi Paradox. We explore the problem in a way that avoids assumptions about the intent and motivation of any exo-civilization seeking to settle other planetary systems. We first consider the speed of an advancing settlement via probes of finite velocity and range to determine if the galaxy can become inhabited with space-faring civilizations on timescales shorter than its age. We also include the effect of stellar motions on the long term behavior of the settlement front which adds a diffusive component to its advance. The results of these models demonstrate that the Milky Way can be readily ‘filled-in’ with settled stellar systems under conservative assumptions about interstellar spacecraft velocities and launch rates. We then consider the question of the galactic steady-state achieved in terms of the fraction of settled planets. We do this by considering the effect of finite settlement civilization lifetimes on the steady states. We find a range of parameters for which the galaxy supports a population of interstellar space-faring civilizations even though some settleable systems are uninhabited. Both results point to ways in which Earth might remain unvisited in the midst of an inhabited galaxy. Finally we consider how our results can be combined with the finite horizon for evidence of previous settlements in Earth’s geologic record. Our steady-state model can constrain the probabilities for an Earth visit by a settling civilization before a given time horizon. These results break the link between Hart’s famous “Fact A” (no interstellar visitors on Earth now) and the conclusion that humans must, therefore, be the only technological civilization in the galaxy.

Arc/Info Binary Grid import

I have had occasional issues with the import of Arc/Info Binary Grid format files into ARCGIS. The solution is all too easy. The import script is legacy and relies on the oldest of ARCGIS file and directory formatting requirements, no spaces. No spaces in parent directories or file names. The naming convention in ARCGIS is really quite annoying at times.