All posts by John C. Menzies

First Production from Bangka by Chevron Indonesia

Chevron Indonesia has started production from the Bangka Field in the Kutei Basin offshore East Kalimantan following an investment decision by the company in 2014 and subsequent Indonesian government approvals.  Development drilling commenced in September 2014.

Chevron Production platform

Geology

The 60,000 km2 Kutei basin extends from the central highlands of Borneo, across the eastern coast of the island and into the Makassar Strait. It is the largest Tertiary basin in Indonesia with up to 15 km of sediment.  The Kutei is an extensional basin in a foreland tectonic setting. Extension began in the Mid Eocene with subsequent thermal sag, and isostatic subsidence.  Rapid, high volume, sedimentation related to uplift and inversion began in the Early Miocene.

Syn-rift deposition in the Eocene was focused in small, localised depocenters within individual half-grabens.  The initial graben fill is highly variable due to the wide zone of rifting, and ranges from fully terrestrial in the western basin, to entirely marine in the eastern basin.  Syn-rift sedimentation following the initial graben fill is variable across the basin, but several distinct facies tracts have been identified. Non marine, deltaic, shallow marine, deep marine and carbonate platform syn-rift deposits are found in the basin.

Sag phase deposition began in the Upper Eocene to Oligocene. A regional depocenter developed in response to marine transgression. The eastern basin, already influenced by marine conditions quickly transitioned to a deep marine depositional environment, while the western basin transitioned more slowly. A thick marine shale was deposited across much of the basin, while carbonate sedimentation continued on along the basin margin and across topographic highs.

Large carbonate platforms developed along the basin margins as the result of shallowing marine environments in the early phases of the Late Oligocene tectonic inversion combined with a marine regression. As tectonic uplift of central Borneo continued into the lower Miocene, the westernmost portion of the Kutai Basin was inverted above sea level, forming the Upper Kutai Basin.\n\nIn the Early Miocene large amounts of clastic sediment derived from the rising central mountains, and the now inverted Paleogene flowed into the lower Kutai Basin. Basin inversion in the middle Miocene and Pliocene saw a shift in the deltaic depo-centre eastwards into the Makassar Straight.

Neogene sediments in the vicinity of the modern Mahakam delta are up to 9 kilometres thick with total sediment thickness of up to 15 km.

Production & Development

In the Kutei Basin in East Kalimantan, most of the Chevron production has come from 14 offshore fields in the shelf area within the East Kalimantan PSC, with the remainder from the deepwater West Seno Field in the Makassar Strait PSC.\n\nThe development will be the first deep-water subsea tieback thus far in Indonesia and will utilise subsea well connections to the West Seno FPU.  It will also be Indonesia’s first deepwater flexible pipeline and the first single deepwater umbilical installed.

Nameplate production capacity in this initial development stage is 110 MMcf/d of natural gas and 4,000 b/d of condensate. Chevron has a 62% operating interest in the Bangka project with ENI SA holding a 20% interest and Tip Top Energy Ltd with 18% interest.

Manaslu, Nepal: October 2016

Team CMI is now preparing for 3 weeks hiking around Manaslu.

We will climb to base camp and reach 17,000 feet.  October 2016 before heading over the Larkya La (pass).   Manaslu is the eighth highest mountain in the world reaching 8,163 metres (26,781 ft) above sea level. It is located in the a part of the Nepalese Himalayas known as the Mansiri Himal.  Manaslu means “mountain of the spirit” in Nepalese comes from the Sanskrit word manasa, meaning “intellect” or “soul”.  Manaslu was first climbed on May 9, 1956 by Toshio Imanishi.  Our expedition will start a few kilometres from the epicentre of the 2015 earthquake that devastated much of the country.

A Very Quiet Sun

Solar Disk 20160704 – Very Quiet with no numbered sun spots on the face

As we come off the Solar Maximum the sun continues to show very low levels of activity.  For months solar activity has been at very low levels despite being at solar max.  Currently there are no numbered sunspots on the disk and activity is expected to remain at these levels for the coming few days (the limit of forecast capability).  The geomagnetic field is also at low levels and solar winds peaked at 593 km/sec at 03/0341Z.  As we head into what could be the quietest solar minimum in several hundred years the impact on climate will be very interesting.

International sunspot number Sn, with last 13 years and forecasts

Given the hiatus in global temperatures in the last 20 years plus the onset of La Nina Pacific Ocean cooling event, the coming Northern Winter could be a cold one.  Given that we are at the peak of the warming cycle,  we could well be close to the terminal phase prior to a significant decrease in global temperatures.  Will the coincidence of La Nina and weak Solar Minimum prove to be a tipping point in global climate.  Given the current orientation of the earth, this would seem quite likely in coming few years.

Reference Sites:

Stalagmite Research in the SW Pacific Highlights the complexity of Global Climate

Stalagmite Research in the SW Pacific Highlights the complexity of Global Climate

Interesting research published in Nature communications comments on the global warming pause, the Little Ice Age impacts in the Pacific and the over simplicity of climate models.  The stalagmites used in this study (LR06-B1 and LR06-B3) were collected from Liang Luar, an ~1.7-km-long cave situated on the east Indonesian island of Flores (8° 32’N, 120° 26’E; 550m above sea level.  They used U/Th dating, 18O and 13C isotope profiles, trace element analysis, principle component analysis and GCMs to conclude that:

  • “from the beginning of this century until recently, the tropical Pacific was locked into a negative Interdecadal Pacific Oscillation phase (that is, low-frequency La Niña-like pattern) in association with increased Walker and Hadley circulation winds and eastern Pacific cooling”
  • “The La Niña-like pattern is thought to be a factor contributing to the recent so-called ‘warming hiatus and earlier twentieth century cool and warm decades”.
  • “Therefore, our analysis of multi-century hydroclimate variability suggests that projections of tropical rainfall patterns, and global temperature extremes, will remain uncertain until paleoclimate records and models consistently capture the lower-frequency variability, and associated feedbacks, in the tropical Pacific”.

Importantly, in this data there is clear evidence that the dry period evident around the turn of the last millennium coincides with the approximate timing of the Medieval Climate Anomaly ~950–1250 CE seen in Europe.    The Little Ice Age event (widely thought to have been a largely European event) can be seen in this data with a ~400-year reduction in AISM rainfall recovering in strength at around 1300, and by 1500 is above average –  coincident with the Little Ice Age. Maximum rainfall in Flores at ~1600 CE, amongst the wettest periods of the past 2,000 years, is synchronous (within dating uncertainty) with peak cooling in the Northern Hemisphere and maximum ice discharge in the North Atlantic.  This is solid evidence for the global nature of the MCA and LIA.

Abstract

Interdecadal modes of tropical Pacific ocean-atmosphere circulation have a strong influence on global temperature, yet the extent to which these phenomena influence global climate on multi century timescales is still poorly known. Here we present a 2,000-year, multiproxy reconstruction of western Pacific hydroclimate from two speleothem records for southeastern Indonesia. The composite record shows pronounced shifts in monsoon rainfall that are antiphased with precipitation records for East Asia and the central-eastern equatorial Pacific. These meridional and zonal patterns are best explained by a poleward expansion of the Australasian Intertropical Convergence Zone and weakening of the Pacific Walker circulation (PWC) between ~1000 and 1500 CE Conversely, an equatorward contraction of the Intertropical Convergence Zone and strengthened PWC occurred between ~1500 and 1900 CE. Our findings, together with climate model simulations, highlight the likelihood that century-scale variations in tropical Pacific climate modes can significantly modulate radiatively forced shifts in global temperature.

Original Research Paper:  Read Here

Download PDF: Here

Climate and Sea Level – Regular Dramatic Change over 1.2 Ma

As  can be seen in the above graphic,  isotopic data derived from ice-cores, deep-sea sediment sediments and other proxies shows dramatic and a characteristic “saw-tooth” signature over the Pleistocene  (1.2 million years).

For a compilation of the same oxygen isotope and other data over the last 2.7 million years (which shows the same repetitive saw tooth change in climate/temperature proxies) see the image below:

Global chronostratigraphical correlation table for the last 2.7 million years.  High Resolution Image

This data shows very clearly that longer periods of slow cooling are followed (or preceded!) by dramatic periods of warming.  The current warming period commenced well before recent industrialisation and consistent with the trend and the satellite temperature data would now seem to be at or close to its peak.  Is it any wonder that humanity has prospered during this warming period.

This data suggests that we should expect a slow cooling in the near future and the implications  of that for humanity will be serious with declines in crop production and likely population unless we have averted the catastrophic impacts through CO2 emissions.

Fossil fuel usage saved the earth from the ravage of a growing population in the past and it is possible that it is now saving humanity from the next ice-age that is if the miniscule contribution of humanity to planet wide CO2 production is having any meaningful impact.

Original Research:  

No Ordinary Rock

Looks like any old rock –  but this is no ordinary rock, its on the surface of Mars.

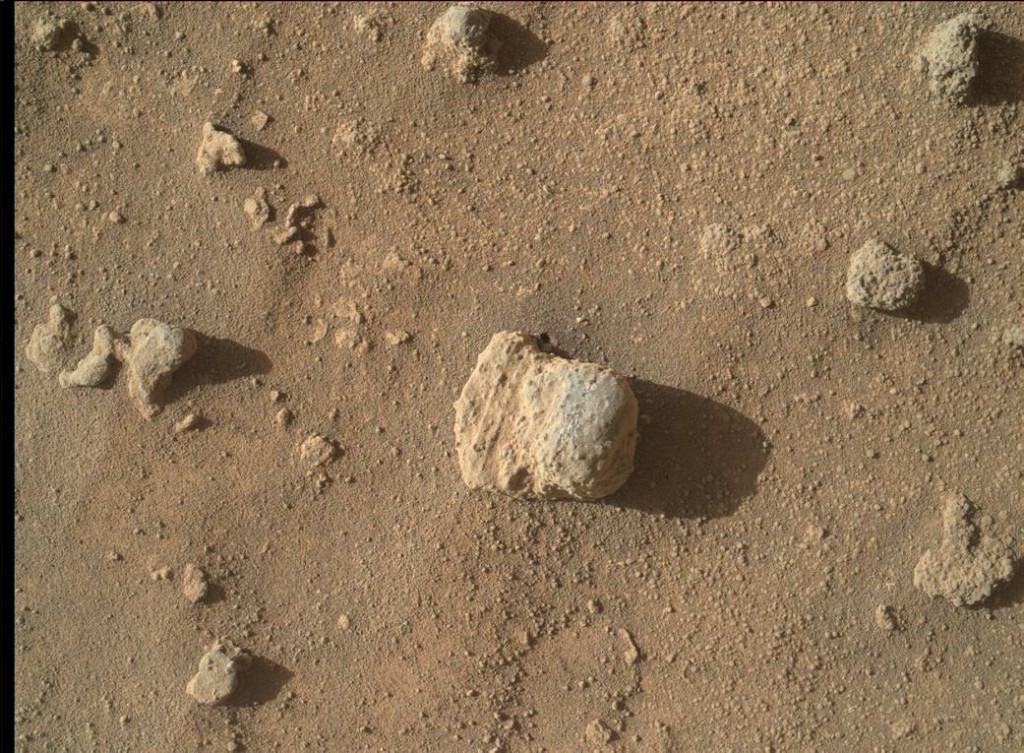
This rock was photographed a couple of days ago using the Mars Hand Lens Imager (MAHLI) on NASA’s Curiosity Mars rover. Curiosity has now been operational on Mars for 1, 282 days.

The unassuming rock in the center of this image consists of laminated sandstone with small nodules  and is 2 cms across.  Weathered nodules litter the ground around the rock.

This nodule is about one inch (two centimeters) across. It appears within the composite image below in the left foreground.  The image was taken on a Sol 1276 view  from Curiosity Mast Camera.

Panoramic image from the Mast Camera.  The rock above is from the left of the image.  The image field is around 2×1.5 metres.  More Detail.

Patches of Martian sandstone visible in the lower-left and upper portions of this view from the Mast Camera of NASA’s Curiosity Mars rover have a knobbly texture due to nodules apparently more resistant to erosion than the host rock in which some are still embedded.

The site is at a zone on lower Mount Sharp where mudstone of the Murray geological unit — visible in the lower right corner here — is exposed adjacent to the overlying Stimson unit. The exact contact between Murray and Stimson here is covered with windblown sand. Most other portions of the Stimson unit investigated by Curiosity have not shown erosion-resistant nodules. Curiosity encountered this unusually textured exposure on the rover’s approach to the “Naukluft Plateau.”

Just for a little perspective, while we view the geology on another plant, its a little more than 100 years since we first flew in the air!

More information on the Image is available here.

A Planet of Plates

Chris Harrison from Department of Marine Geosciences, Rosenstiel School of Marine and Atmospheric Science, University of Miami  in a paper in Earth,  Planets and Space has sought to resolve the question of the number plates that make up the surface of the earth.

Major Plate Boundaries. By USGS – http://pubs.usgs.gov/publications/text/slabs.html, Public Domain, https://commons.wikimedia.org/w/index.php?curid=535201

The number of tectonic plates on Earth described in the literature has expanded greatly since the start of the plate tectonic era, when only about a dozen plates were considered in global models of present-day plate motions.  With an ever-increasing number of earthquake monitoring sites, improving  ocean bathymetry using swath mapping, and the use of space based geodetic techniques, there has been a huge growth in the number of plates thought to exist.  In 2003 the total was thought to be 52 delineated on the basis of earthquake epicentre data.

Chris now proposes a total of 159 plates (with some additional smaller plates yet to be mapped).

The largest plate (Pacific) is about 20 % of the Earth’s area or 104 million km2, and the smallest plate is only 273 km2. The Earth is continuously evolving with the continuous creation of new oceanic crust and its destruction in subduction zones.  This has a very significant impact on the distribution of continents, movement of water within the worlds oceans (over time) and plays an important part in the evolution of life on this planet.

REF: The present-day number of tectonic plates, Earth, Planets and Space 2016, 68:37.  Download PDF

Abstract

The number of tectonic plates on Earth described in the literature has expanded greatly since the start of the plate tectonic era, when only about a dozen plates were considered in global models of present-day plate motions. With new techniques of more accurate earthquake epicenter locations, modern ways of measuring ocean bathymetry using swath mapping, and the use of space based geodetic techniques, there has been a huge growth in the number of plates thought to exist. The study by Bird (2003) proposed 52 plates, many of which were delineated on the basis of earthquake locations. Because of the pattern of areas of these plates, he suggested that there should be more small plates than he could identify. In this paper, I gather together publications that have proposed a total of 107 new plates, giving 159 plates in all. The largest plate (Pacific) is about 20 % of the Earth’s area or 104 Mm2, and the smallest of which (Plate number 5 from Hammond et al. 2011) is only 273 km2 in area. Sorting the plates by size allows us to investigate how size varies as a function of order. There are several changes of slope in the plots of plate number organized by size against plate size order which are discussed. The sizes of the largest seven plates is constrained by the area of the Earth. A middle set of 73 plates down to an area of 97,563 km2 (the Danakil plate at number 80, is the plate of median size) follows a fairly regular pattern of plate size as a function of plate number. For smaller plates, there is a break in the slope of the plate size/plate number plot and the next 32 plates follow a pattern of plate size proposed by the models of Koehn et al. (2008) down to an area of 11,638 km2(West Mojave plate # 112). Smaller plates do not follow any regular pattern of area as a function of plate number, probably because we have not sampled enough of these very small plates to reveal any clear pattern.

The Silence of the Moons of Saturn

Saturn’s moons Tethys (in the foreground) & Janus (small irregular moon in the background) – Courtesy Cassini spacecraft – nasa.govThe view was obtained at a distance of approximately 593,000 miles (955,000 kilometres) from Janus. Image scale at Janus is 3.7 miles (6 kilometres) per pixel. Tethys was at a distance of 810,000 miles (1.3 million kilometres) for an image scale of 5 miles (8 kilometres) per pixel.

Janus is a small inner moon of Saturn (radius 90 km and density,  0.63 g/cm3 and orbit 151,470 km) and has a nearly identical orbit to the moon, Epimetheus (not seen in this image).  The moons are separated from one another by an astonishingly small 50km.  Every four years they swap orbital positions.  Janus is heavily cratered with the largest having a radius of 30km.  The passage of Janus through the rings of Saturn maintains the sharp edge of the A ring.

Tethys is a mid-sized moon of Saturn (radius 530 km, mean density 0.98 g/cm3, surface gravity 0.15m/s2 and orbit of 294,600 km). Tethys has the lowest density of any of the major moons of Saturn and consists of water ice with just a small fraction of rock.  The surface of Tethys is very bright, being the second-brightest of the moons of Saturn after Enceladus, and neutral in color.

Tethys is heavily cratered and cut by a number of large faults and grabens. The largest impact crater, Odysseus, is about 400 km in diameter and the largest graben, Ithaca Chasma, is about 100 km wide and more than 2000 km long.

Moons like Tethys are large enough that their own gravity is sufficient to overcome the material strength of the substances they are made of (mostly ice in the case of Tethys) and mould them into spherical shapes. But small moons like Janus  are not massive enough for their gravity to form them into a sphere.

For more information.

Archaic Gene Inheritance – From the very commencement of life on earth?

Shenshen Lai and colleagues from the University of British  Columbia report results from a study of protein kinases in eukaryotes (A eukaryote is any organism whose cells contain a nucleus and other organelles enclosed within membranes.

Protein kinases play a pivotal role in communicating intracellular signals in eukaryotes. The family of eukaryotic protein kinases (ePKs) comprises of at least 568 human members,  which accounts for more than 2% of protein coding genes of the entire human genome. These kinases are highly conserved both their primary amino acid sequences in the 3D structures  of their catalytic domains. Because of the central regulatory roles the high conservation of the ePKs,  the ancestry of these enzymes has become an important question in the study of the evolution eukaryotic organisms.

The ePKs and ChPK are responsible for amongst other things the construction of the cell membrane (which allow the development of organelles including the nucleus to develop) and communication between organelles within the cell.  They are likely responsible for the evolution and success of organisms larger than prokaryotic organisms like for example bacteria which lack a nucleus and membrane bounded organelles. Without the early horizontal transfer and preservation of GlnRS life as we know it would likely not exist. GlnRS is found in all complex organisms including plants and animals.

Eukaryotic life is believed to have evolved between 1.7 to 2.7 billion years ago and no living representatives of the earliest eukaryotes survive today. Consequently, the actual origin of protein kinases is difficult to establish with a high degree of confidence.

They conclude that ePKs and ChPKs in eukaryotes evolved from an ancient common mRNA source (possibly at the commencement of life on earth –  or at least very early).  While these proteins are highly degenerate this team has identified two class-I aminoacyl-tRNA synthetases with high similarities to consensus amino acid sequences of human protein-serine/threonine kinases suggesting that horizontal transfer early in evolution gave rise to many contemporary genes.

This research provides solid argument for the continuity of life on early for much of the last 3 billion years and our genetic relationship to the earliest lifeforms on this planet.

Original Research:  Shenshen Lai et al. Evolutionary Ancestry of Eukaryotic Protein Kinases and Choline Kinases, Journal of Biological Chemistry (2016).
DOI: 10.1074/jbc.M115.691428
PDF: Here

Fatty food drives aberrant Stem Cell growth in Mammalian Colon


Nice juicy high fat burger – just want you want – but just what you do not need.

A paper out today in Nature offers new insight into the impact of a high-fat diet  (HFD) on tumor growth and progression:

This study looked at the relationship between a high-fat diet and the how this impacted stem and progenitor cell function.  They found that a HFD in the mammalian intestine modulated a strong peroxisome proliferator-activated receptor delta (PPAR-delta) response in stem cells.  PPAR-delta not only alters the function of intestinal stem cells but importantly non-intestinal progenitor cells nearby allowing the development and growth of intestinal tumors.

Nice juicy high fat burger – just want you want – but just what you do not need.

Mice on the HFD saw a 30-50% weight gain with a  much higher incidence of intestinal tumors than control mice on a normal diet. The researchers saw a significant increase in the number of stem cell in mice on a HFD and importantly the stem cells appeared to grow in a manner which suggested that they were not receiving input immediately adjacent cells – the normal route to cell growth.  Non-stem, progenitor cells in the intestinal walls also started to act like stem cells and exhibited significantly longer lives.

There has been clear epidemiological evidence for a strong link between obesity and colorectal cancer and this study provides a clear and concise mechanism for tumor initiation and propagation. If you are on a HFD its time to change.

Original Research: Nature (2016). DOI: 10.1038/nature17173

High-fat diet enhances stemness and tumorigenicity of intestinal progenitors

Little is known about how pro-obesity diets regulate tissue stem and progenitor cell function. Here we show that high-fat diet (HFD)-induced obesity augments the numbers and function of Lgr5+ intestinal stem cells of the mammalian intestine. Mechanistically, a HFD induces a robust peroxisome proliferator-activated receptor delta (PPAR-delta) signature in intestinal stem cells and progenitor cells (non-intestinal stem cells),  and pharmacological activation of PPAR-delta recapitulates the effects of a HFD on these cells. Like a HFD, ex vivo treatment of intestinal organoid cultures with fatty acid constituents of the HFD enhances the self-renewal potential of these organoid bodies in a PPAR-delta-dependent manner. Notably, HFD- and agonist-activated PPAR-delta signalling endow organoid-initiating capacity to progenitors, and enforced PPAR-delta signalling permits these progenitors to form in vivo tumours after loss of the tumour suppressor Apc. These findings highlight how diet-modulated PPAR-delta activation alters not only the function of intestinal stem and progenitor cells, but also their capacity to initiate tumours.

Original Research: Nature (2016).
DOI: 10.1038/nature17173