Introduction
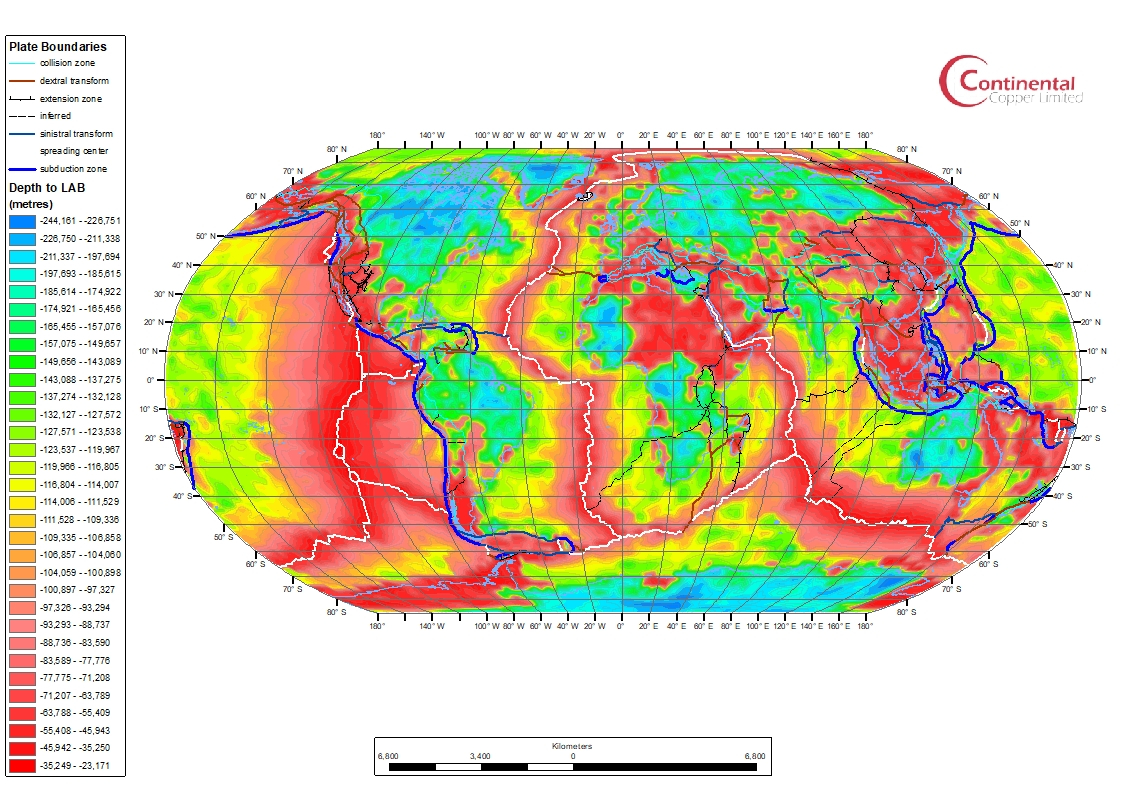
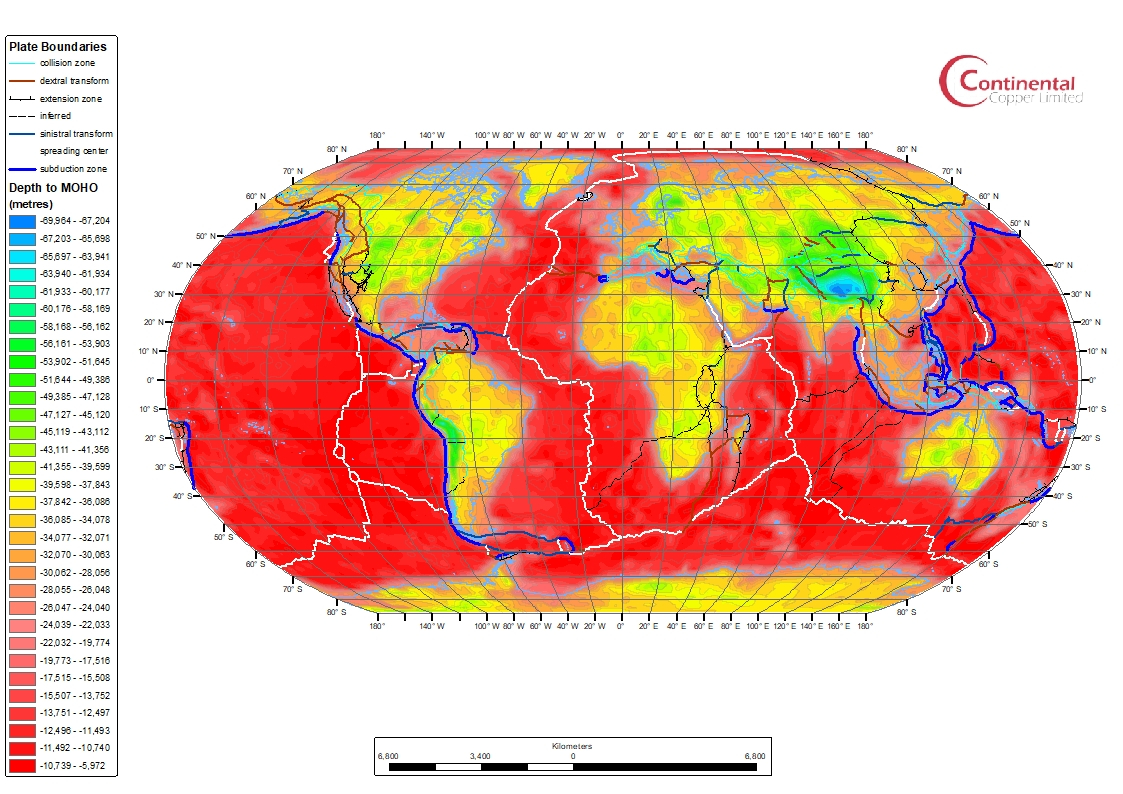
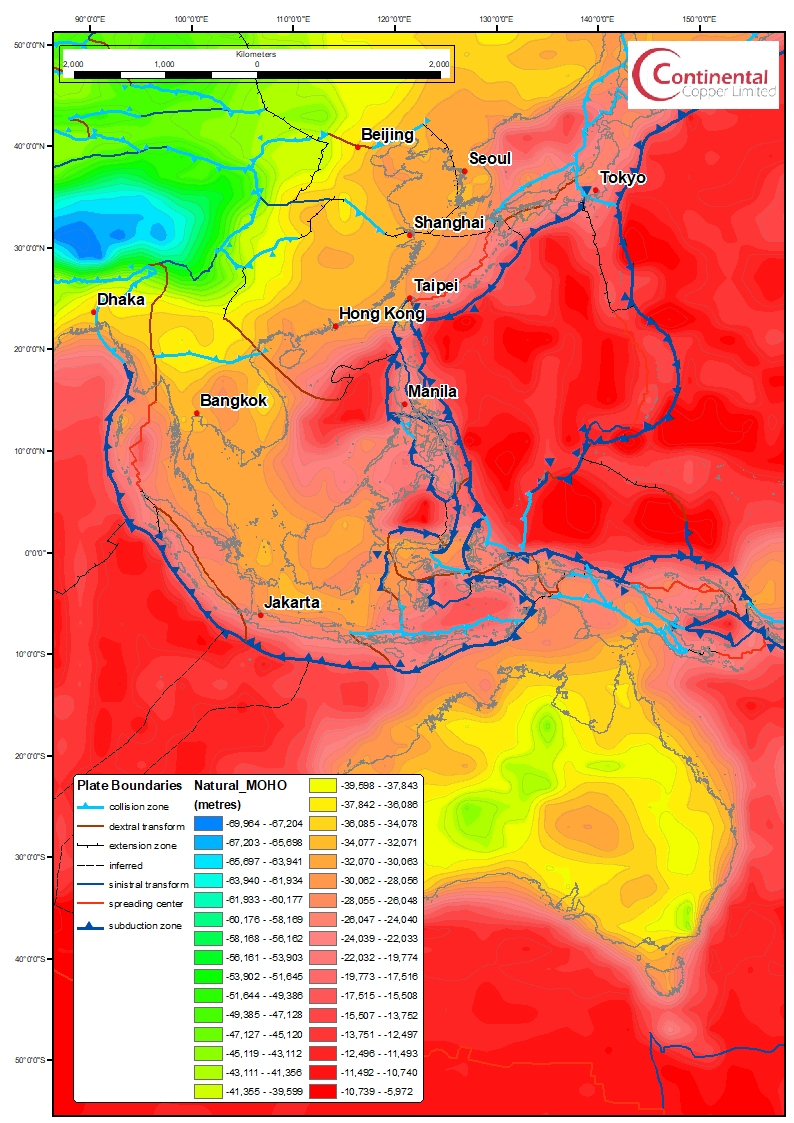
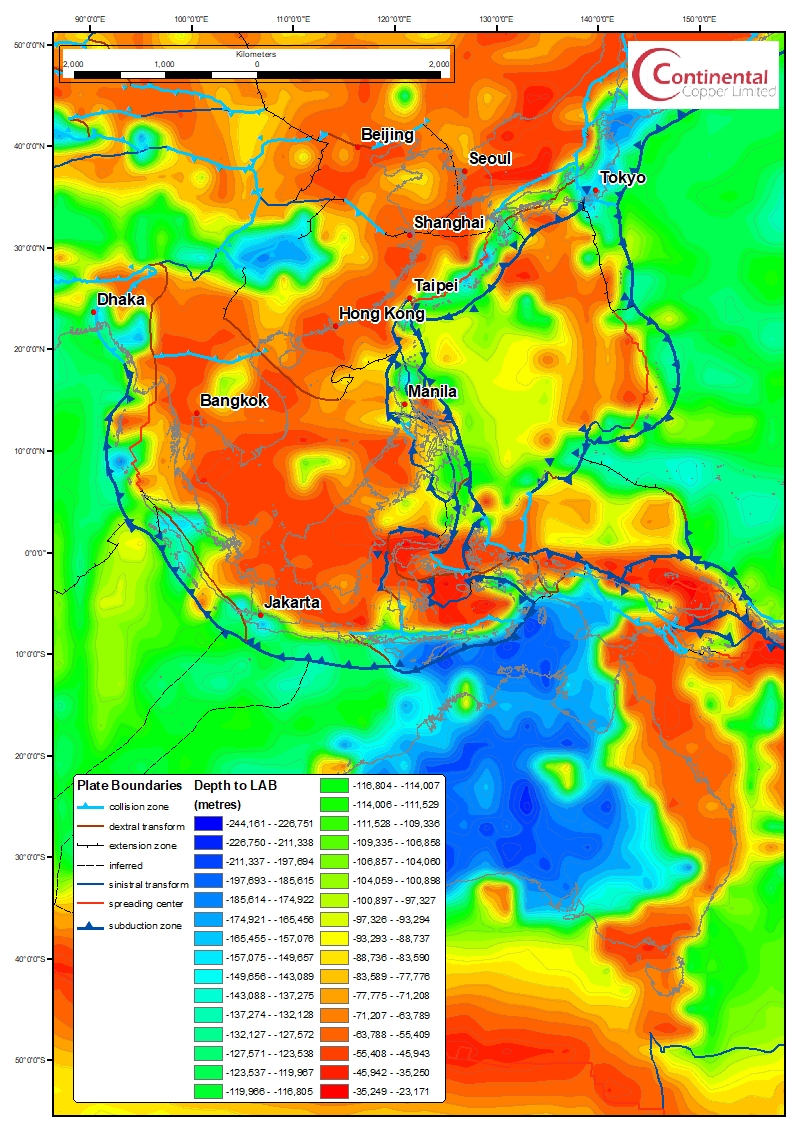
The Earth’s lithosphere is its rigid outer shell, which rests on the more fluid asthenosphere. The thickness of the lithosphere varies, from a few kilometers at ocean spreading centers to 250-300 kilometers within continental cratons. There are two significant seismic boundaries in the crust and upper mantle: the Mohorovicic Discontinuity (Moho), indicating a change from felsic-to-mafic rocks to ultramafic peridotites, and the Lithosphere-Asthenosphere Boundary (LAB), which signifies a shift from a strong, plate-like layer to a weaker, convective asthenosphere over geological time. This transition occurs around the conductive-adiabatic geotherm intersection, where heat transfer shifts from conduction to convection.
The thickness of the continental lithosphere depends on its tectono-thermal age, increasing from 60-80 kilometers in active extensional regions to 100-160 kilometers in older terranes and up to 200-300 kilometers in ancient cratons. Some exceptions exist in cratons affected by more recent tectonic and magmatic events. The lithosphere appears as a seismic high-wavespeed layer, or “lid,” over a low-wavespeed zone or a gradual decrease in seismic wavespeed with depth. This boundary is referred to as the “8°-discontinuity” or the mid-lithosphere discontinuity (MLD). Different seismic methods may detect different depths for the LAB or MLD, depending on their sensitivity.
The cratonic LAB is subject to debate, with some proposing a broad thermal boundary zone and others suggesting a sharper transition influenced by factors such as chemical composition, melt content, or vertical anisotropy variation. The presence of an observable S-to-P (Sp) conversion in seismic data requires a thermal gradient of at least 20°C per kilometer. While such gradients are common beneath oceanic and non-cratonic areas, cratons typically exhibit much lower gradients. Multiple factors, including various scales of mantle convection, can contribute to localized high thermal gradients at the LAB.
A new Lithospheric and Tectonic Global Model
In this post we incorporate the data from two recent global studies, the LithoRef18 model of the lithosphere and upper mantle and an updated global compilation of active plate boundaries and geological provinces.
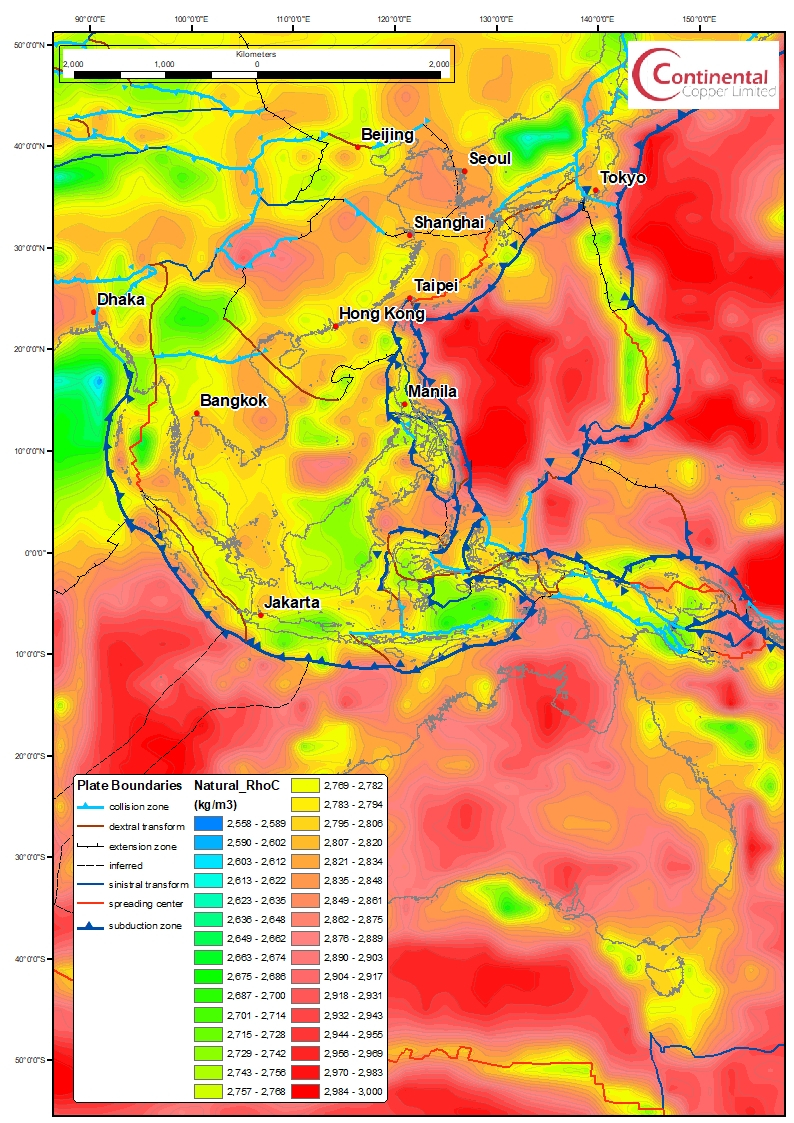
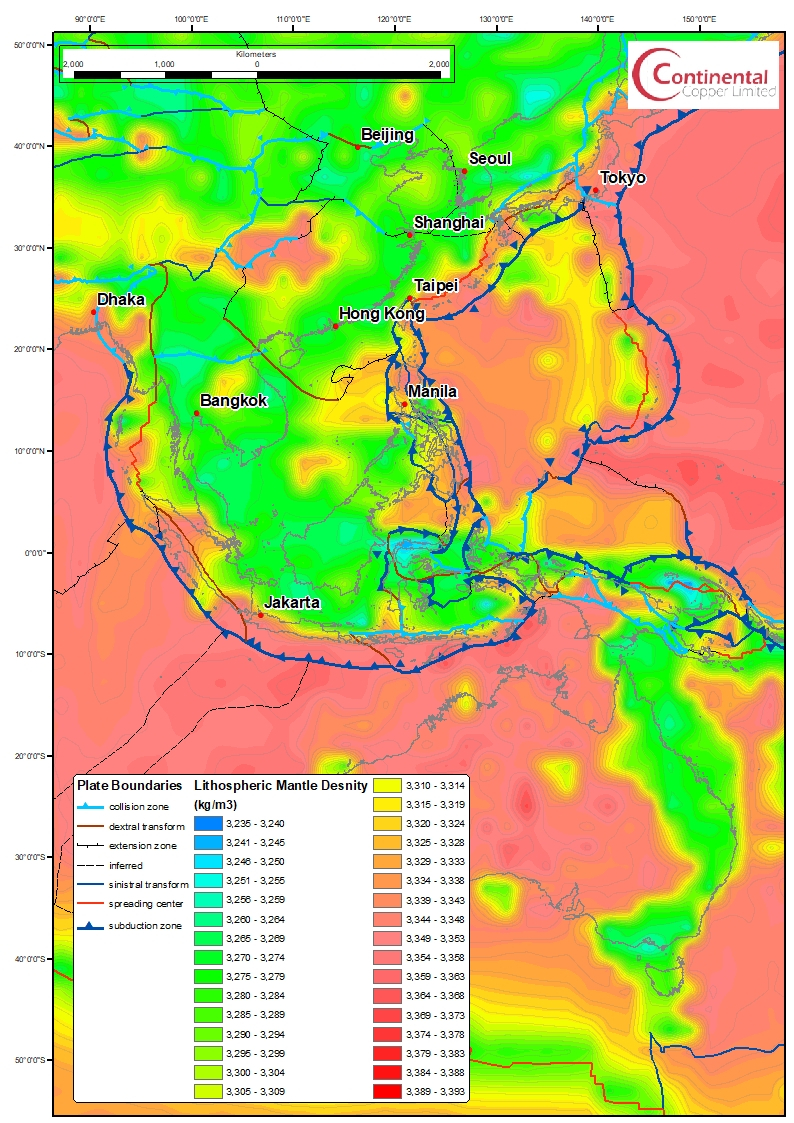
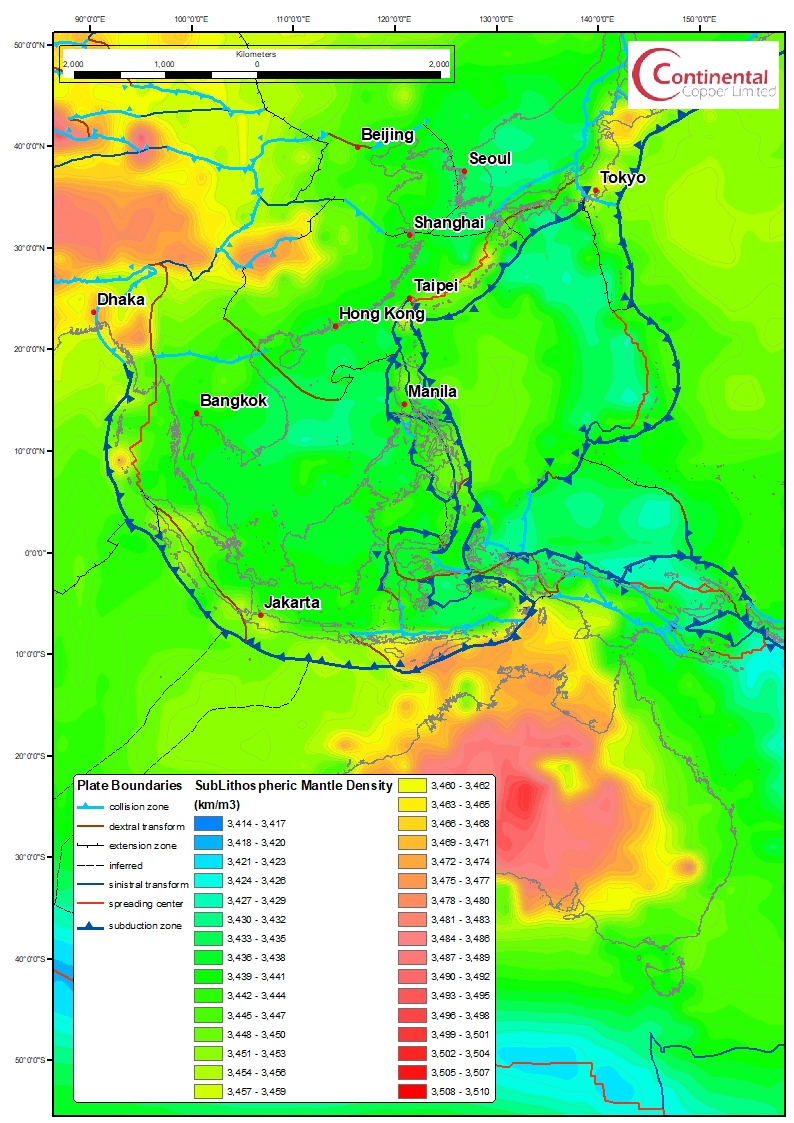
(Afonso, 2019) generated a new global model for the Earth’s lithosphere and upper mantle, called LithoRef18. It was developed through a joint inversion process. This model combines data from 3-D gravity anomalies, geoid height, satellite-derived gravity gradients, absolute elevation, and incorporates prior information from seismic, thermal, and petrological sources. LithoRef18 includes details such as crustal thickness, average crustal density, lithospheric thickness, density variation within the lithospheric mantle, lithospheric geotherms, and the average density of the sub-lithospheric mantle down to 410 km depth. The model is spatially discretized at a 2° × 2° resolution.
The results from LithoRef18 align closely with estimates from recent seismic tomography models, particularly in terms of lithospheric thickness and sub-lithospheric density structure. In various regions around the world, the model provides improved values for crustal thickness and density compared to previous global crustal models.
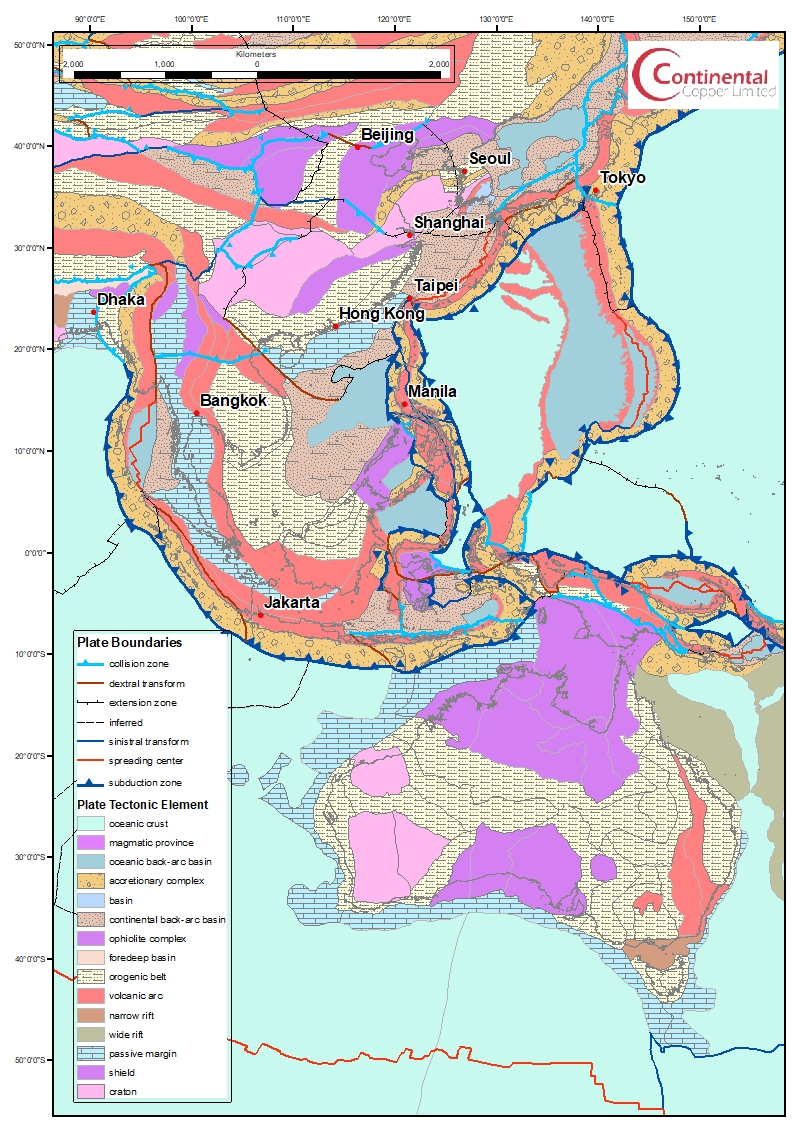
Here we have interpolated the discretized grid data for Crustal, Lithospheric and Sub-Lithospheric Mantle Densities and the depth to the MOHO and the Lithosphere Aesthenosphere Boundary (LAB) and incorporated the recent work of (Hasterok, 2022) who undertook an updated global compilation of active plate boundaries and geological provinces. This work presented a global compilation of tectonic plate boundaries and geological provinces, including information about crust type, plate type, province type, and the timing of the last orogeny. The initial boundaries were based on existing global and regional models, which are refined using various geoscientific constraints such as relative GPS motions, seismic activity, mapped fault lines, potential field data, and geochronology. The new plate model offers better correlation with observed earthquake and volcanic activity within deformation zones and microplates. Oceanic crust covers approximately 57.5% of the Earth’s surface, slightly more than previous seafloor age models suggest. The timing of the last orogenies in the model aligns well with peaks in globally aggregated geochronological data.
Bibliography
Afonso, J., Salajegheh, F., Szwillus, W., Ebbing, J., and Gaina, C. (2019). A global reference model of the lithosphere and upper mantle from joint inversion and analysis of multiple data sets. Geophys. J. Int.
Hasterok, D., Halpin, J., Collins, A., Hand, M., Kreemer, C., Gard, M. and Glorie, S. (2022). New Maps of Global Geological Provinces and Tectonic Plates. Earth-Science Reviews, doi.org/10.1016/j.earscirev.2022.104069.