Daily Rate of Arctic Sea Ice Accumulation in 2019 Approaches Record High
The well known reduction in Arctic Sea Ice extent during the summer months continued during 2019. This trend has been recorded since the beginning of the satellite instrumental record. The minimum ice extent has fallen from 6.9 million km2 in 1979 to 4 million km2 in 2019 while the maximum ice extent has fallen from 16.6 million km2 to 14.9 million km2 in 2019.
The median ice extent shows a consistent linear trend from 12.8 million km2 in 1979 to 11 million km2 in 2019.
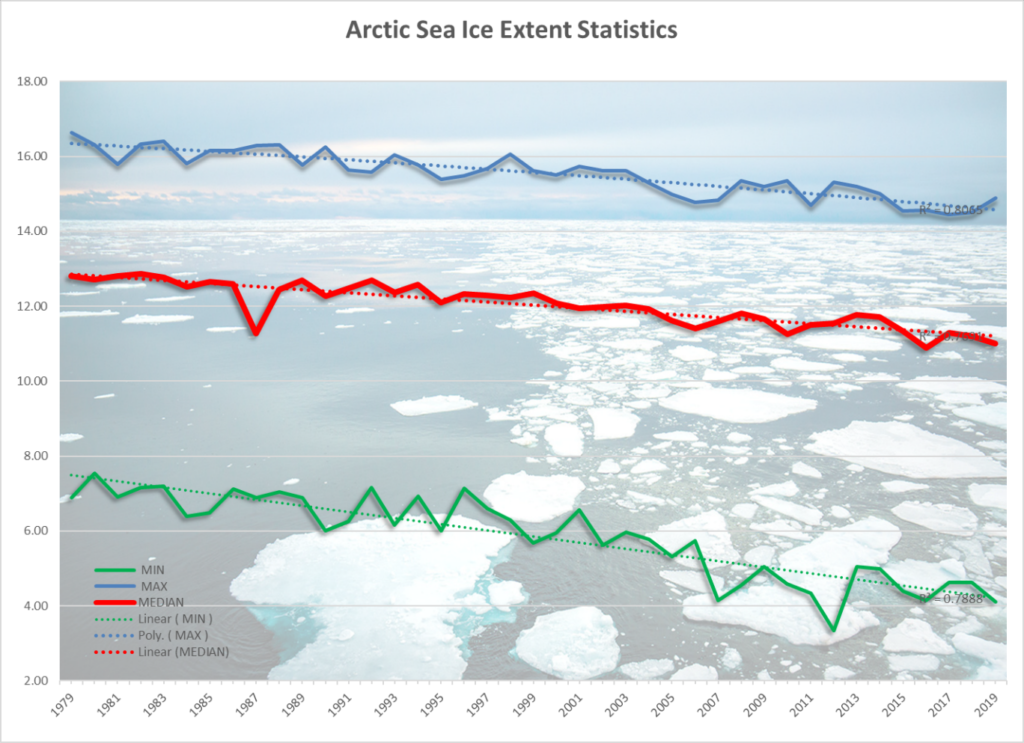
Figure 1 Minimum, Maximum and Media of Arctic sea ice for the period 1979 through 2019
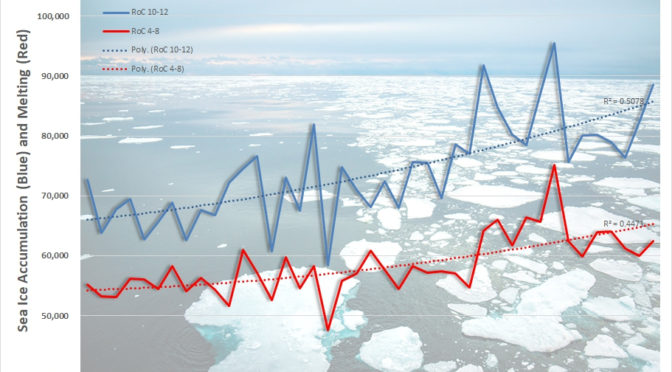
The average daily rate of melting from April through August has increased from 54,000 km2 per day in 1979 to peak in 2011 at 74,000 km2 per day.
Interestingly the daily rate rate of sea ice accumulation in the period October through December has increased from 67,000km2 in 1979 to peak at 95,000km2 in 2012. The current daily rate of accumulation in 2019-2020 is again approaching the highest levels in the instrumental record. Difficult to see anything other than natural processes in this record given its limited duration. Historic records however suggest that the low summer ice extent recorded of recent time was as common in the early 20th century.
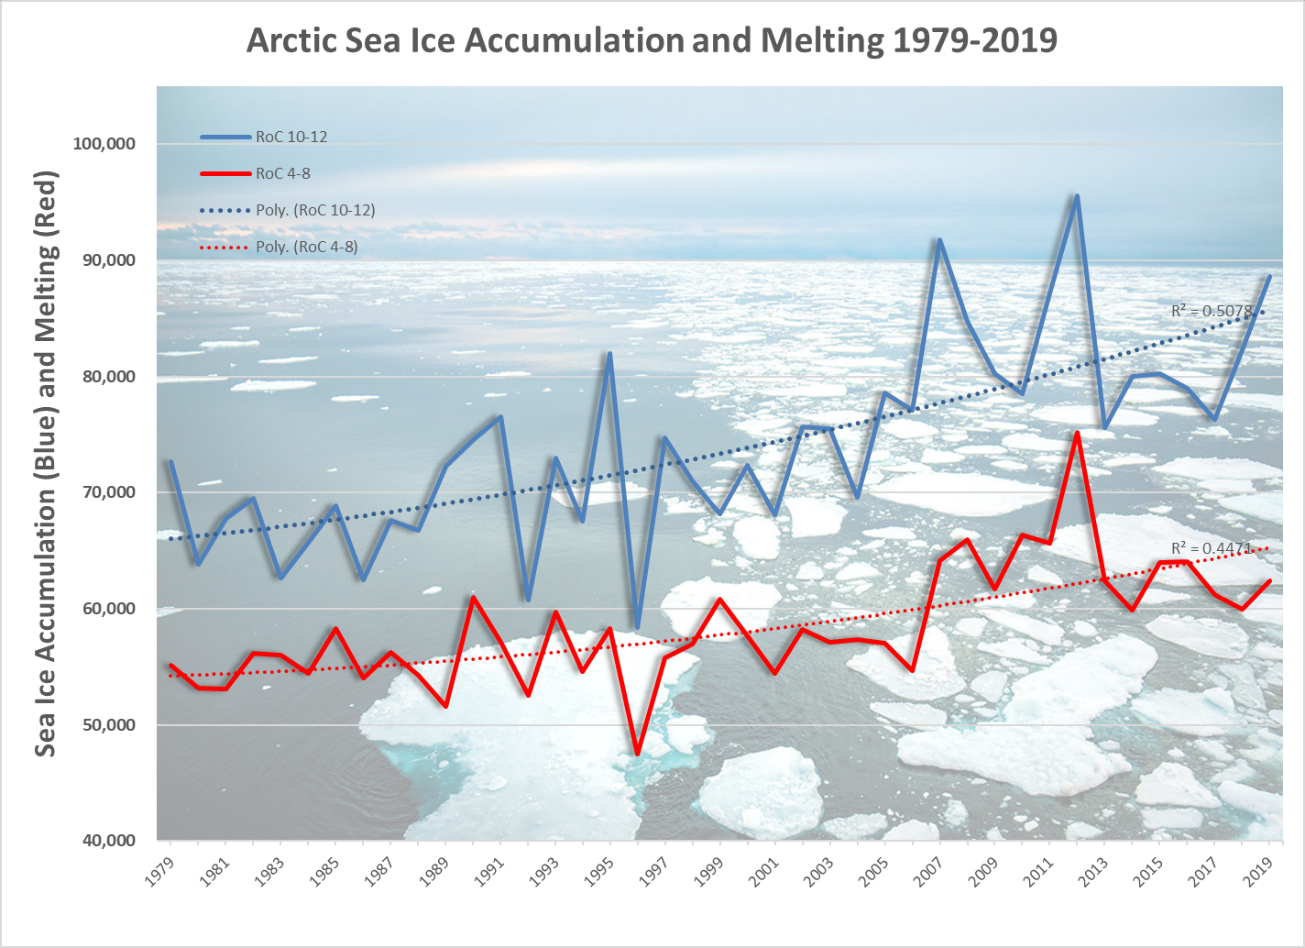
Figure 2 Rate of melting (Red) and Accumulation (Blue) of Arctic Sea Ice during the period 1979 through 2019
The sea ice extent data discussed here relies on data from the Multisensor Snow and Ice Mapping System (IMS) that runs at the National Ice Center. The IMS product uses several satellite data sources including passive microwave, but it is also based on visual analysis and other data sources and undergoes a form of manual data fusion. The data reported here was sourced from the National Snow and Ice Data Center.