


Imaging the Crust Beneath Cloncurry – Implications for Mineralization
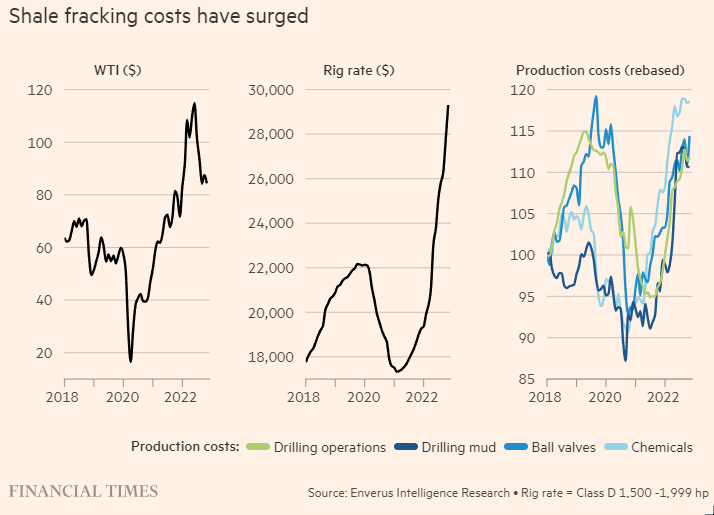
Has Midland and Delaware Basin Oil production peaked?
A large increase in drilling and production costs in the USA Shale Oil sector will likely slow the growth of production from the Permian Basins.
To just maintain production hundreds of new wells must be drilled each year due largely to the rapid decline in tight wells. In the Permian Basins in the last 15 years consolidation has been aggressive and while the largest producers, Chevron, Devon and ConocoPhillps have a sizeable drilling inventory smaller companies have exhausted their drilling locations.
Spectacular New Sidewalks in Siem Reap with mariotitic cavities
Siem Reap has 98km of new roads and new sidewalks much of which has been paved with interesting felsic intrusive rocks from quarries in Shandong Province in China. The composition ranges from granodiorite to tonalite and is locally granophyric and pegmatitic. The intrusive consists dominantly of plagioclase, quartz, pyroxene and hornblende. Ovoid structures known as Miarolitic Cavities are evident in the sidewalks to the observant and indicates that the parental magma was hydrous. While no cavities have been observed in the sidewalks of Siem Reap it is quite possible that miarolitic cavities which retained cavities were not processed into saleable dimension stone. When the location of the quarry in Shandon Province is identified maybe a field trip is warranted.
The term miarolitic comes from the Italian miarole in reference to the mineral-rich pegmatite region of Baveno and Cuasso al Monte in northern Italy.
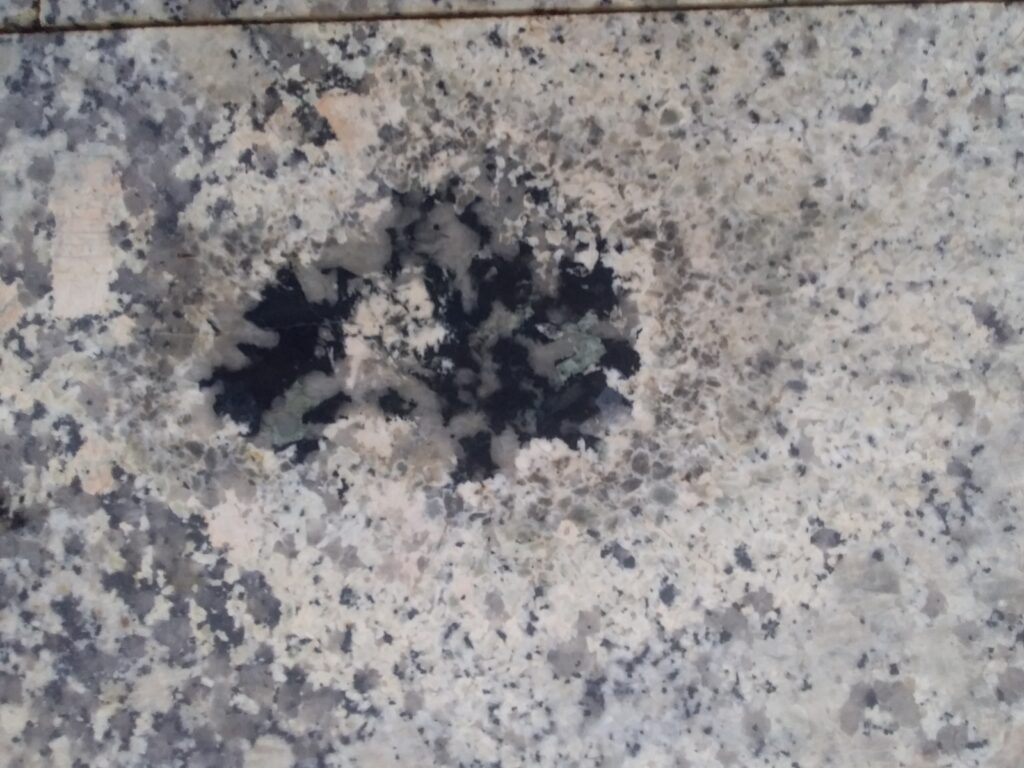
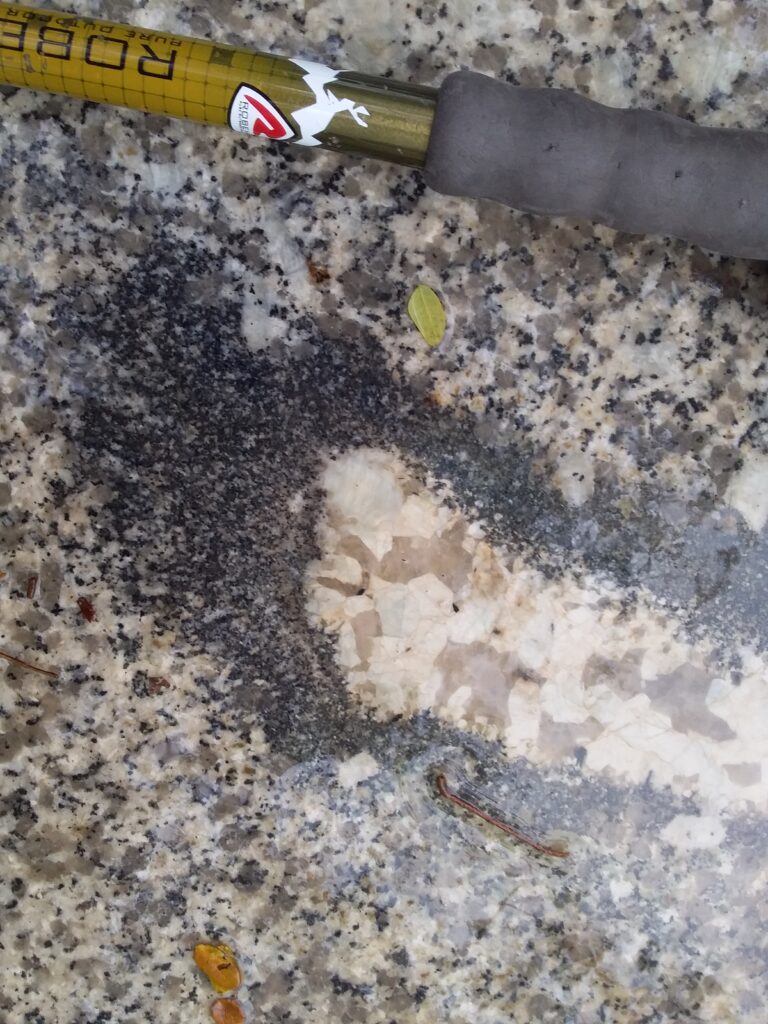
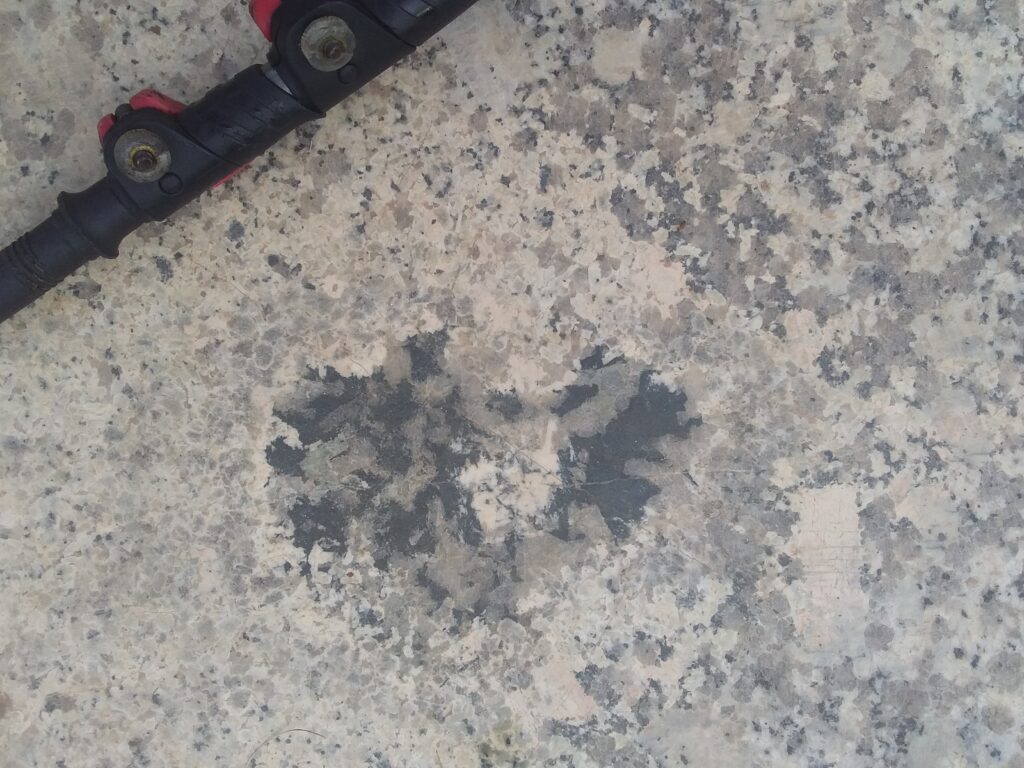
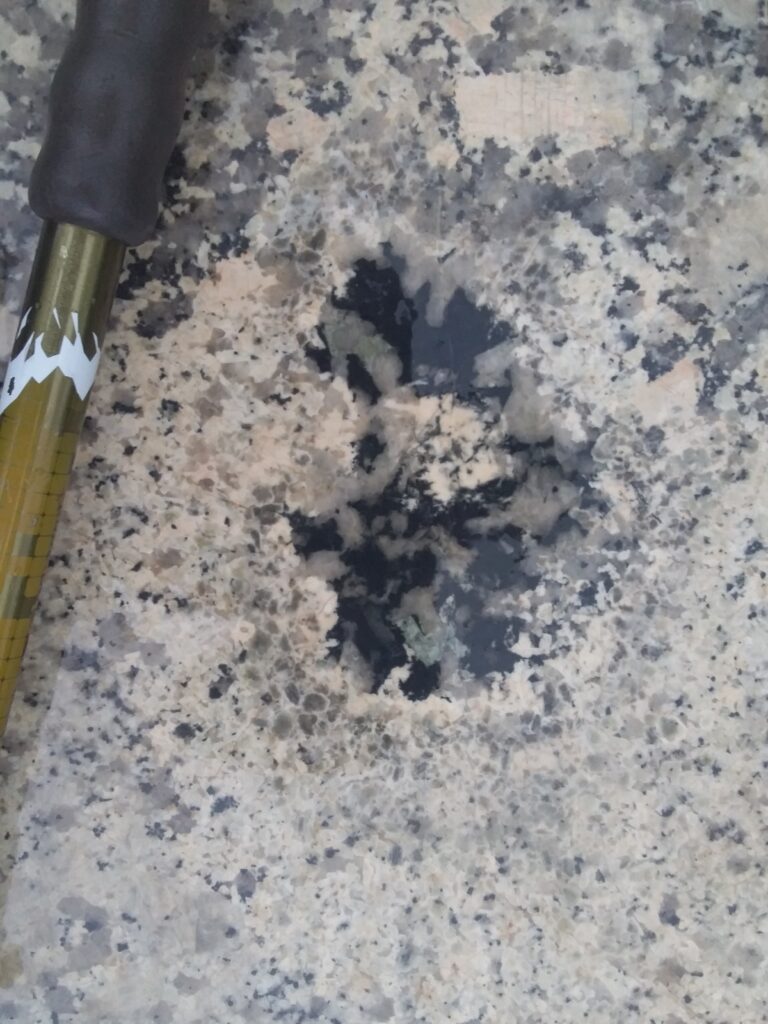
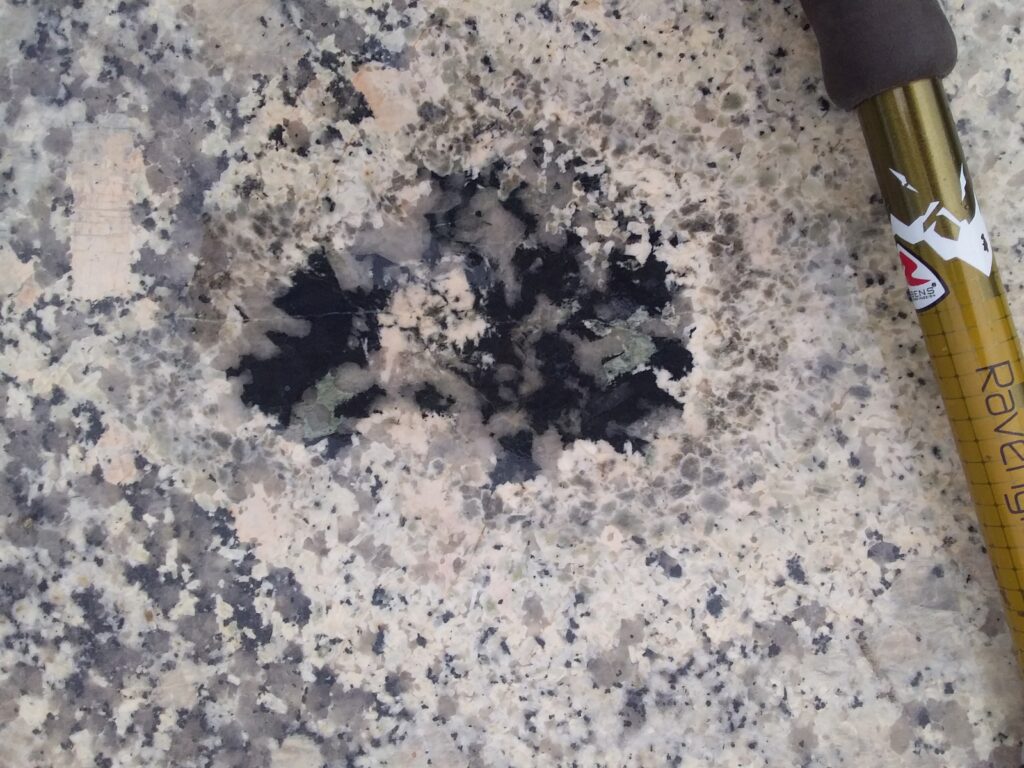
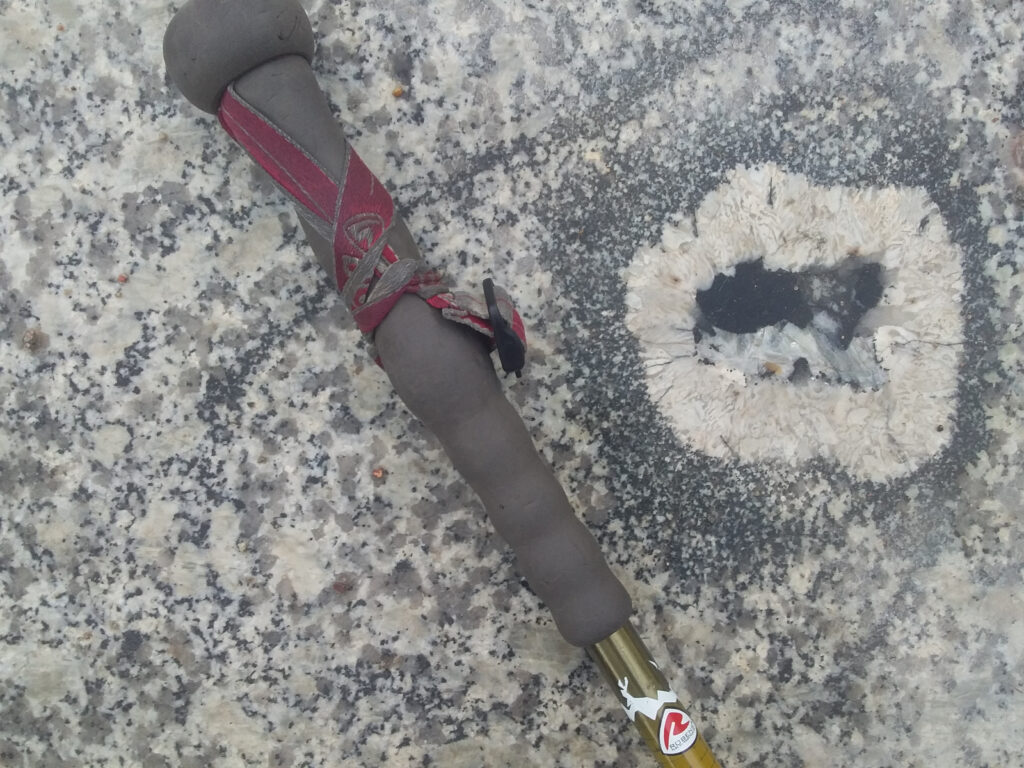
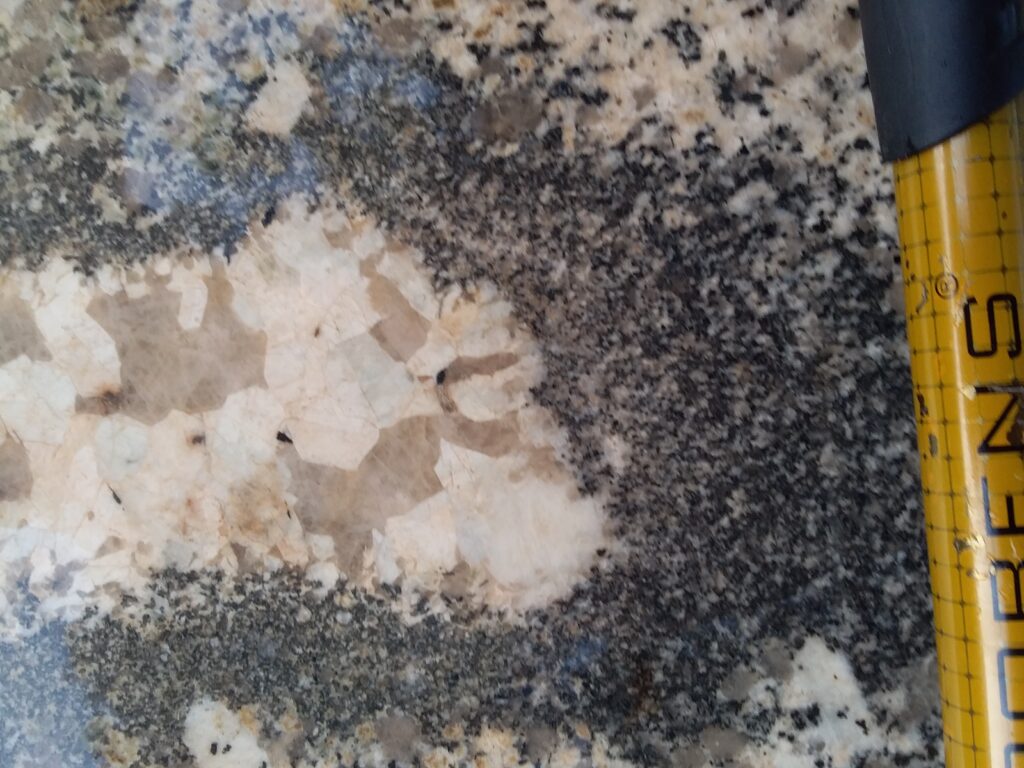

There are two types of miarolitic cavities observed. One has a coarsely pegmatitic core of intergrown quartz and plagioclase surrounded by a conspicuous pyroxene rim and the core may contain coarse tourmaline. The second type has a conspicuous leucocratic zone and a complex core of intergrown quartz and tourmaline. Where there are sufficient sections these features have a long axis that that is maybe 5 times the sectional axis.
Continue reading Spectacular New Sidewalks in Siem Reap with mariotitic cavitiesAN AI VIEW ON QUANTUM ENTANGLEMENT AND BLACK HOLES

Credits: NASA’s Goddard Space Flight Center/Jeremy Schnittman
Download this and related multimedia from NASA Goddard’s Scientific Visualization Studio
I recently had a chat with the Artificial Intelligence application, ChatGPT. ChatGPT (Generative Pre-trained Transformer) is a chatbot launched by OpenAI in November 2022. It is built on top of OpenAI’s GPT-3 family of large language models, and is fine-tuned (an approach to transfer learning) with both supervised and reinforcement learning techniques.
Continue reading AN AI VIEW ON QUANTUM ENTANGLEMENT AND BLACK HOLESSpectacular volcanic eruption in iceland
the transition from lava pond convection to low-intensity fountaining. Video by Leon Frey.
The Fagradalsfjall volcano in Iceland is located on the Reykjanes Peninsular which forms the onshore portion of the Mid-Atlantic Ridge system and erupted several times in 2021.
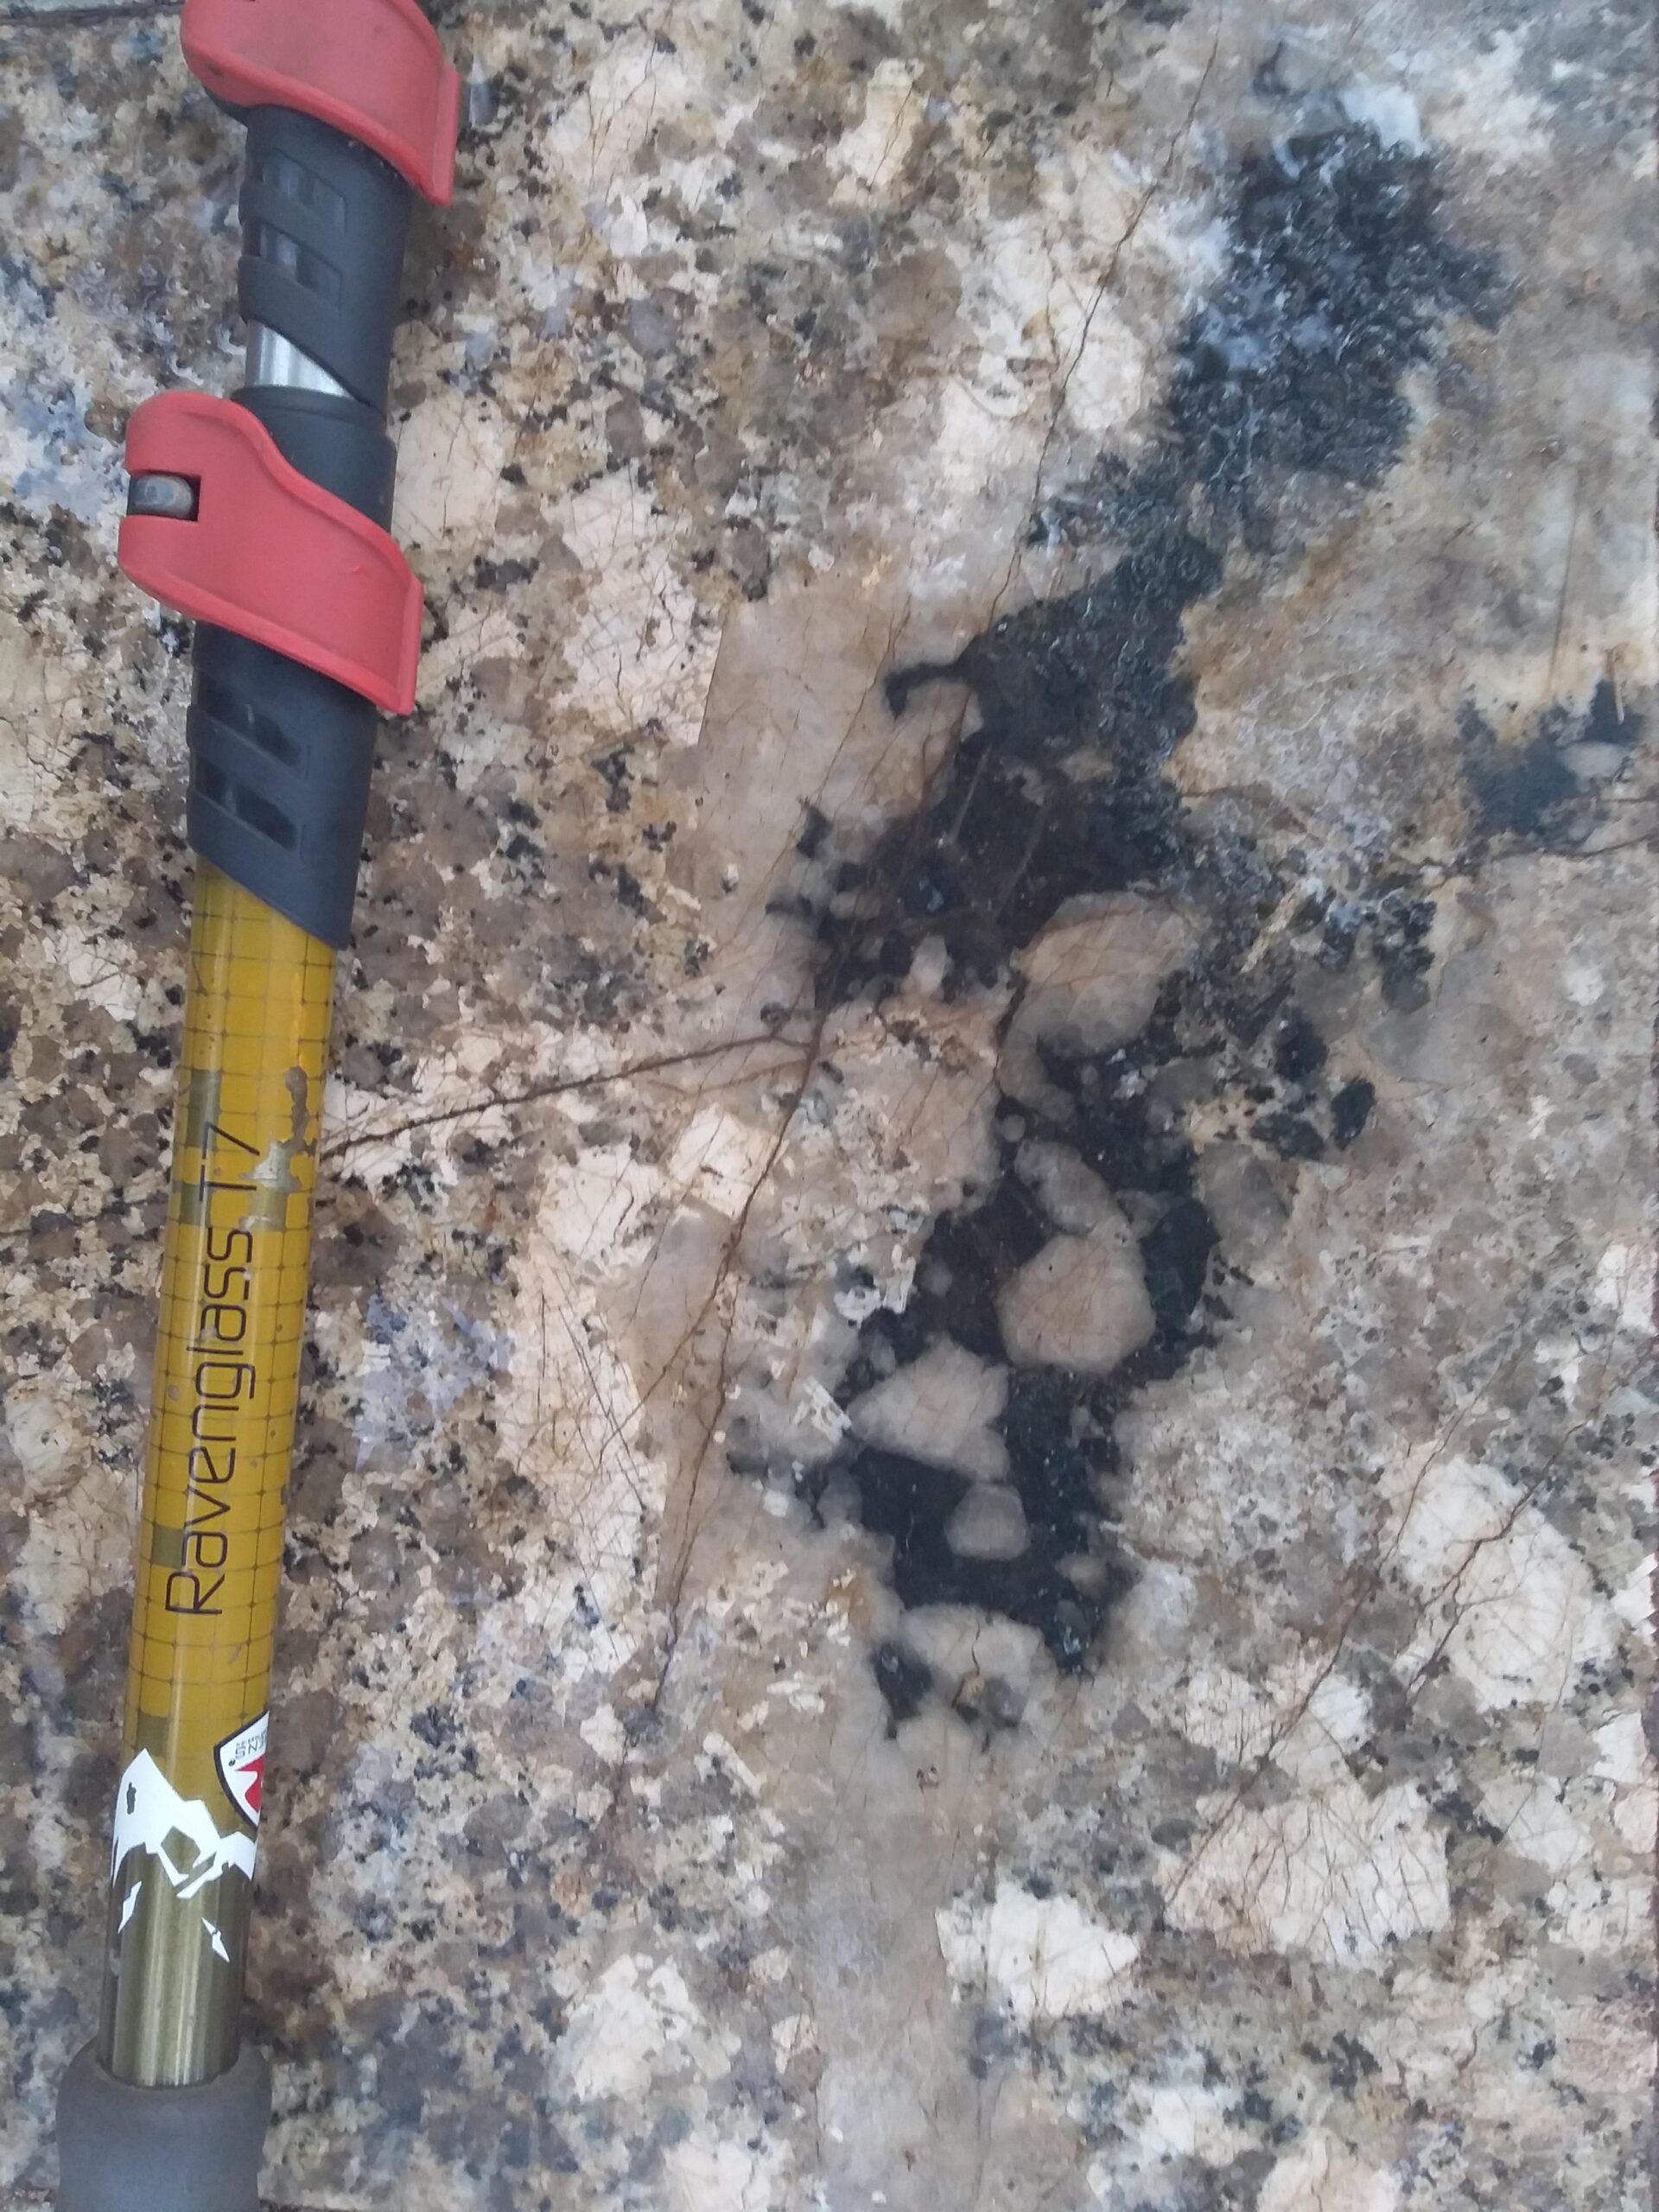
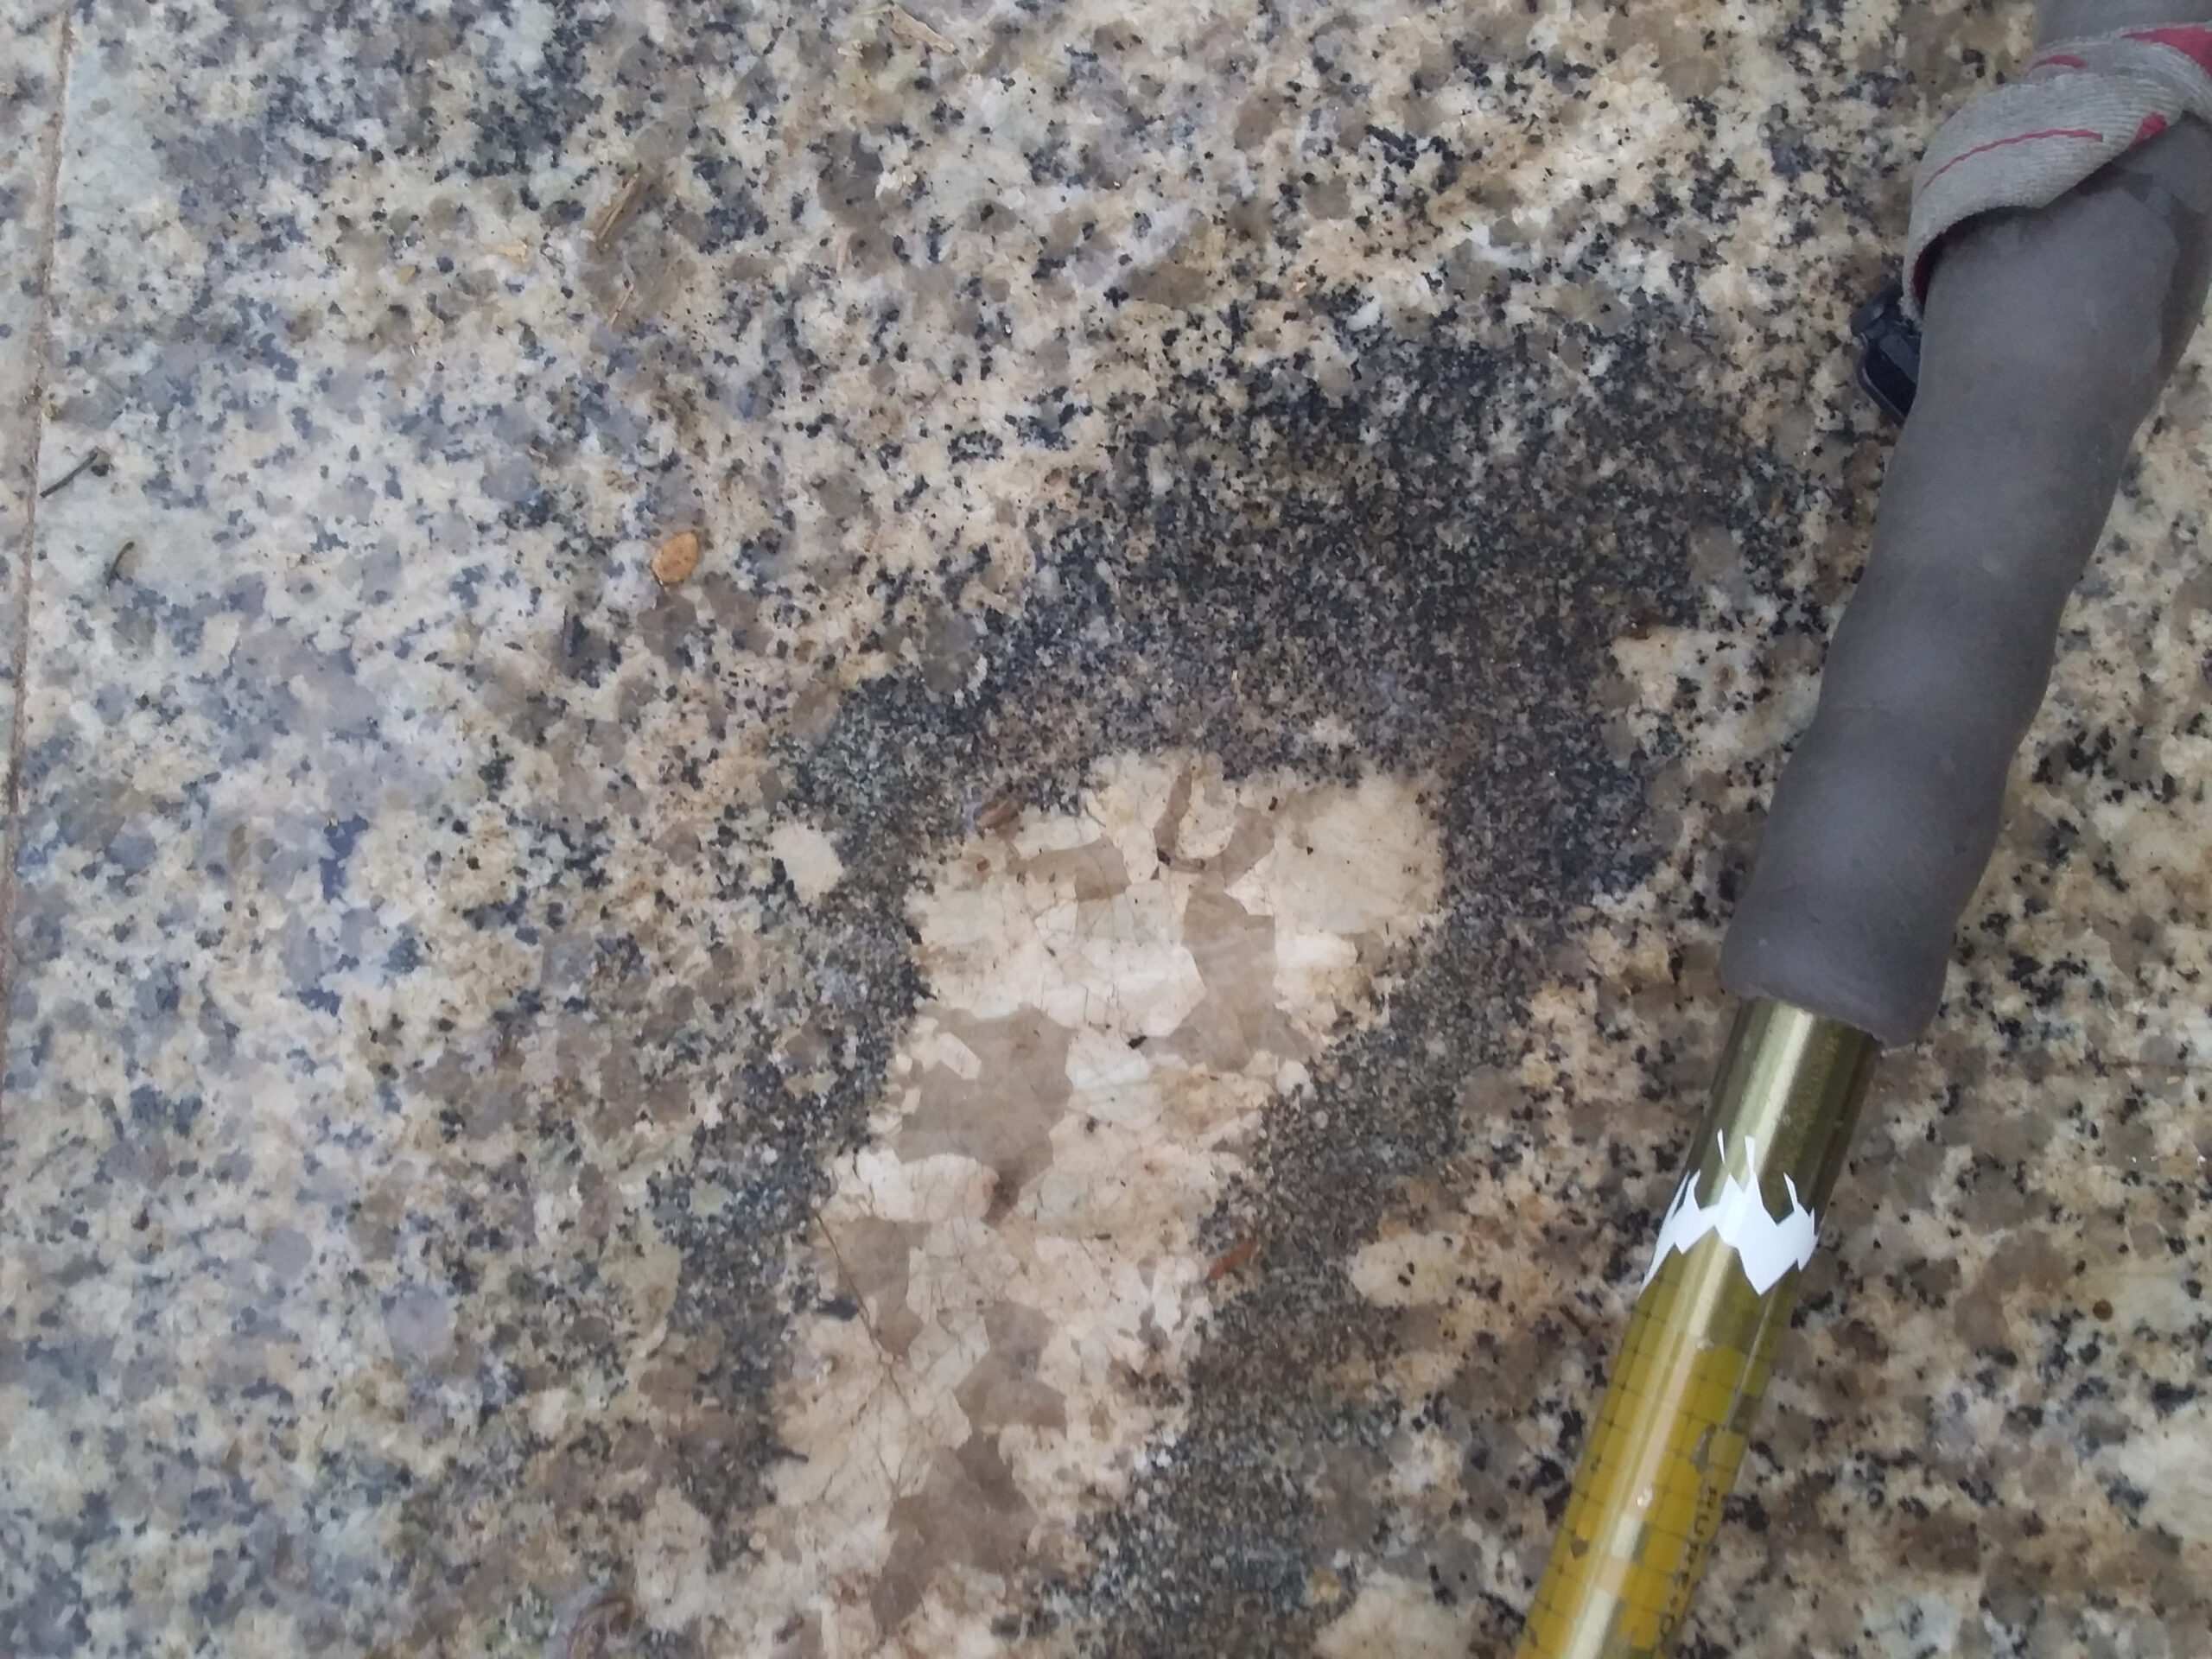
Continue reading Spectacular volcanic eruption in icelandgeochemical sampling in the cambodian jungles is demanding work
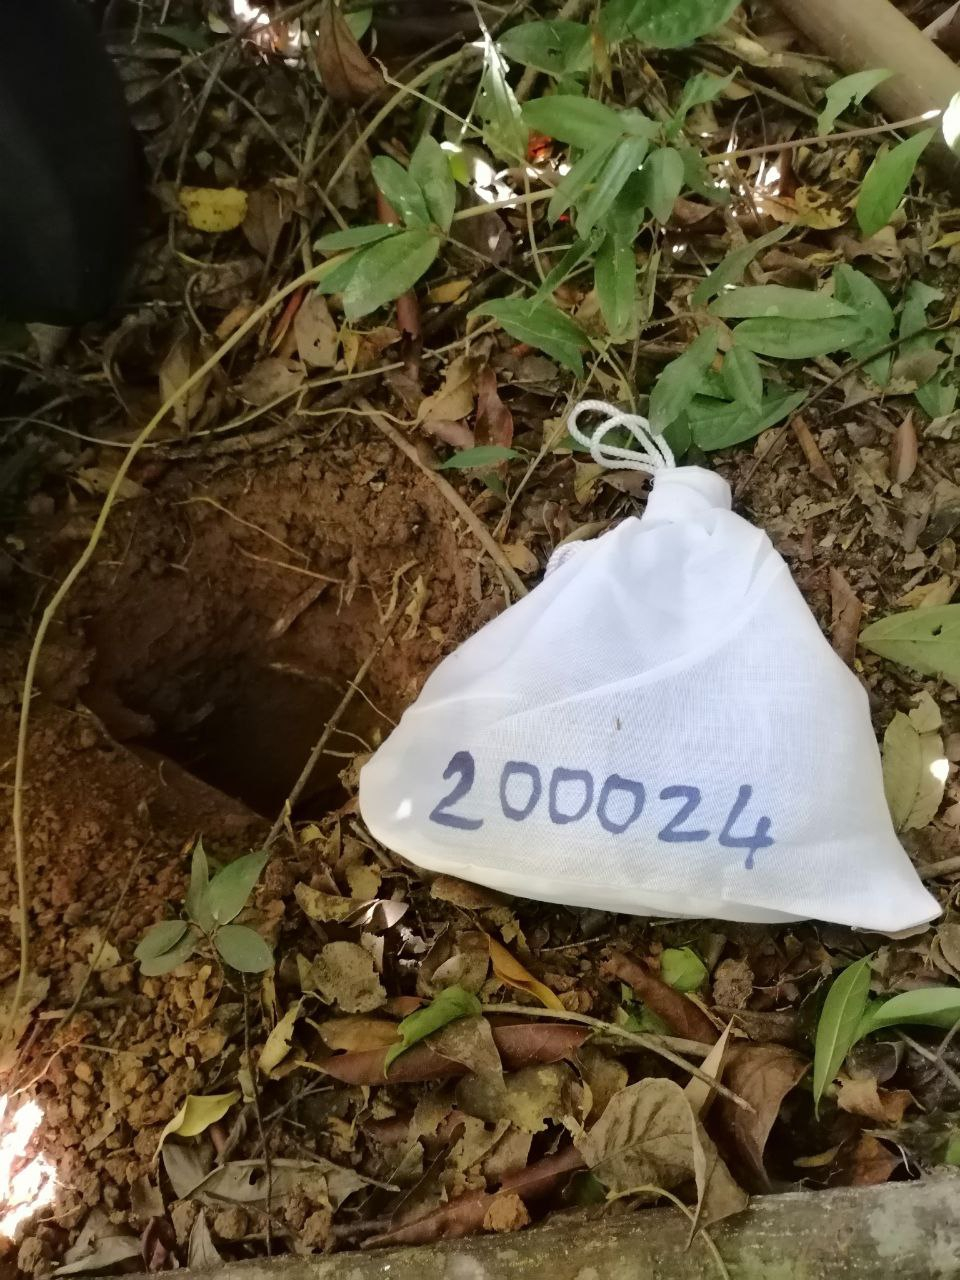
and its all for this – Sample 200024
5 cambodian provinces declared mine free
During Vietnam and the Thai-Cambodian war the Border regions of Cambodia were heavily mined, with mines produced exclusively in China – at least 8 million of them. In the last 30 years the Cambodian Government and private de-mining charities have been systematically demining the country. Demining which is very labour intensive now achieves 250 km2 of clearance per year in Cambodia.
A total of five provinces and the capital had been declared mine-free as of December, as Cambodia’s 2025 goal of becoming mine-free approaches. Stung Treng, Kep, Prey Veng, Preah Sihanouk and Tbong Khmum were declared mine free in December 2022 and Kampong Cham, Takeo, Kampong Chhnang, Kampot, Svay Rieng, and Kandal are expected to be mine-free in 2023.
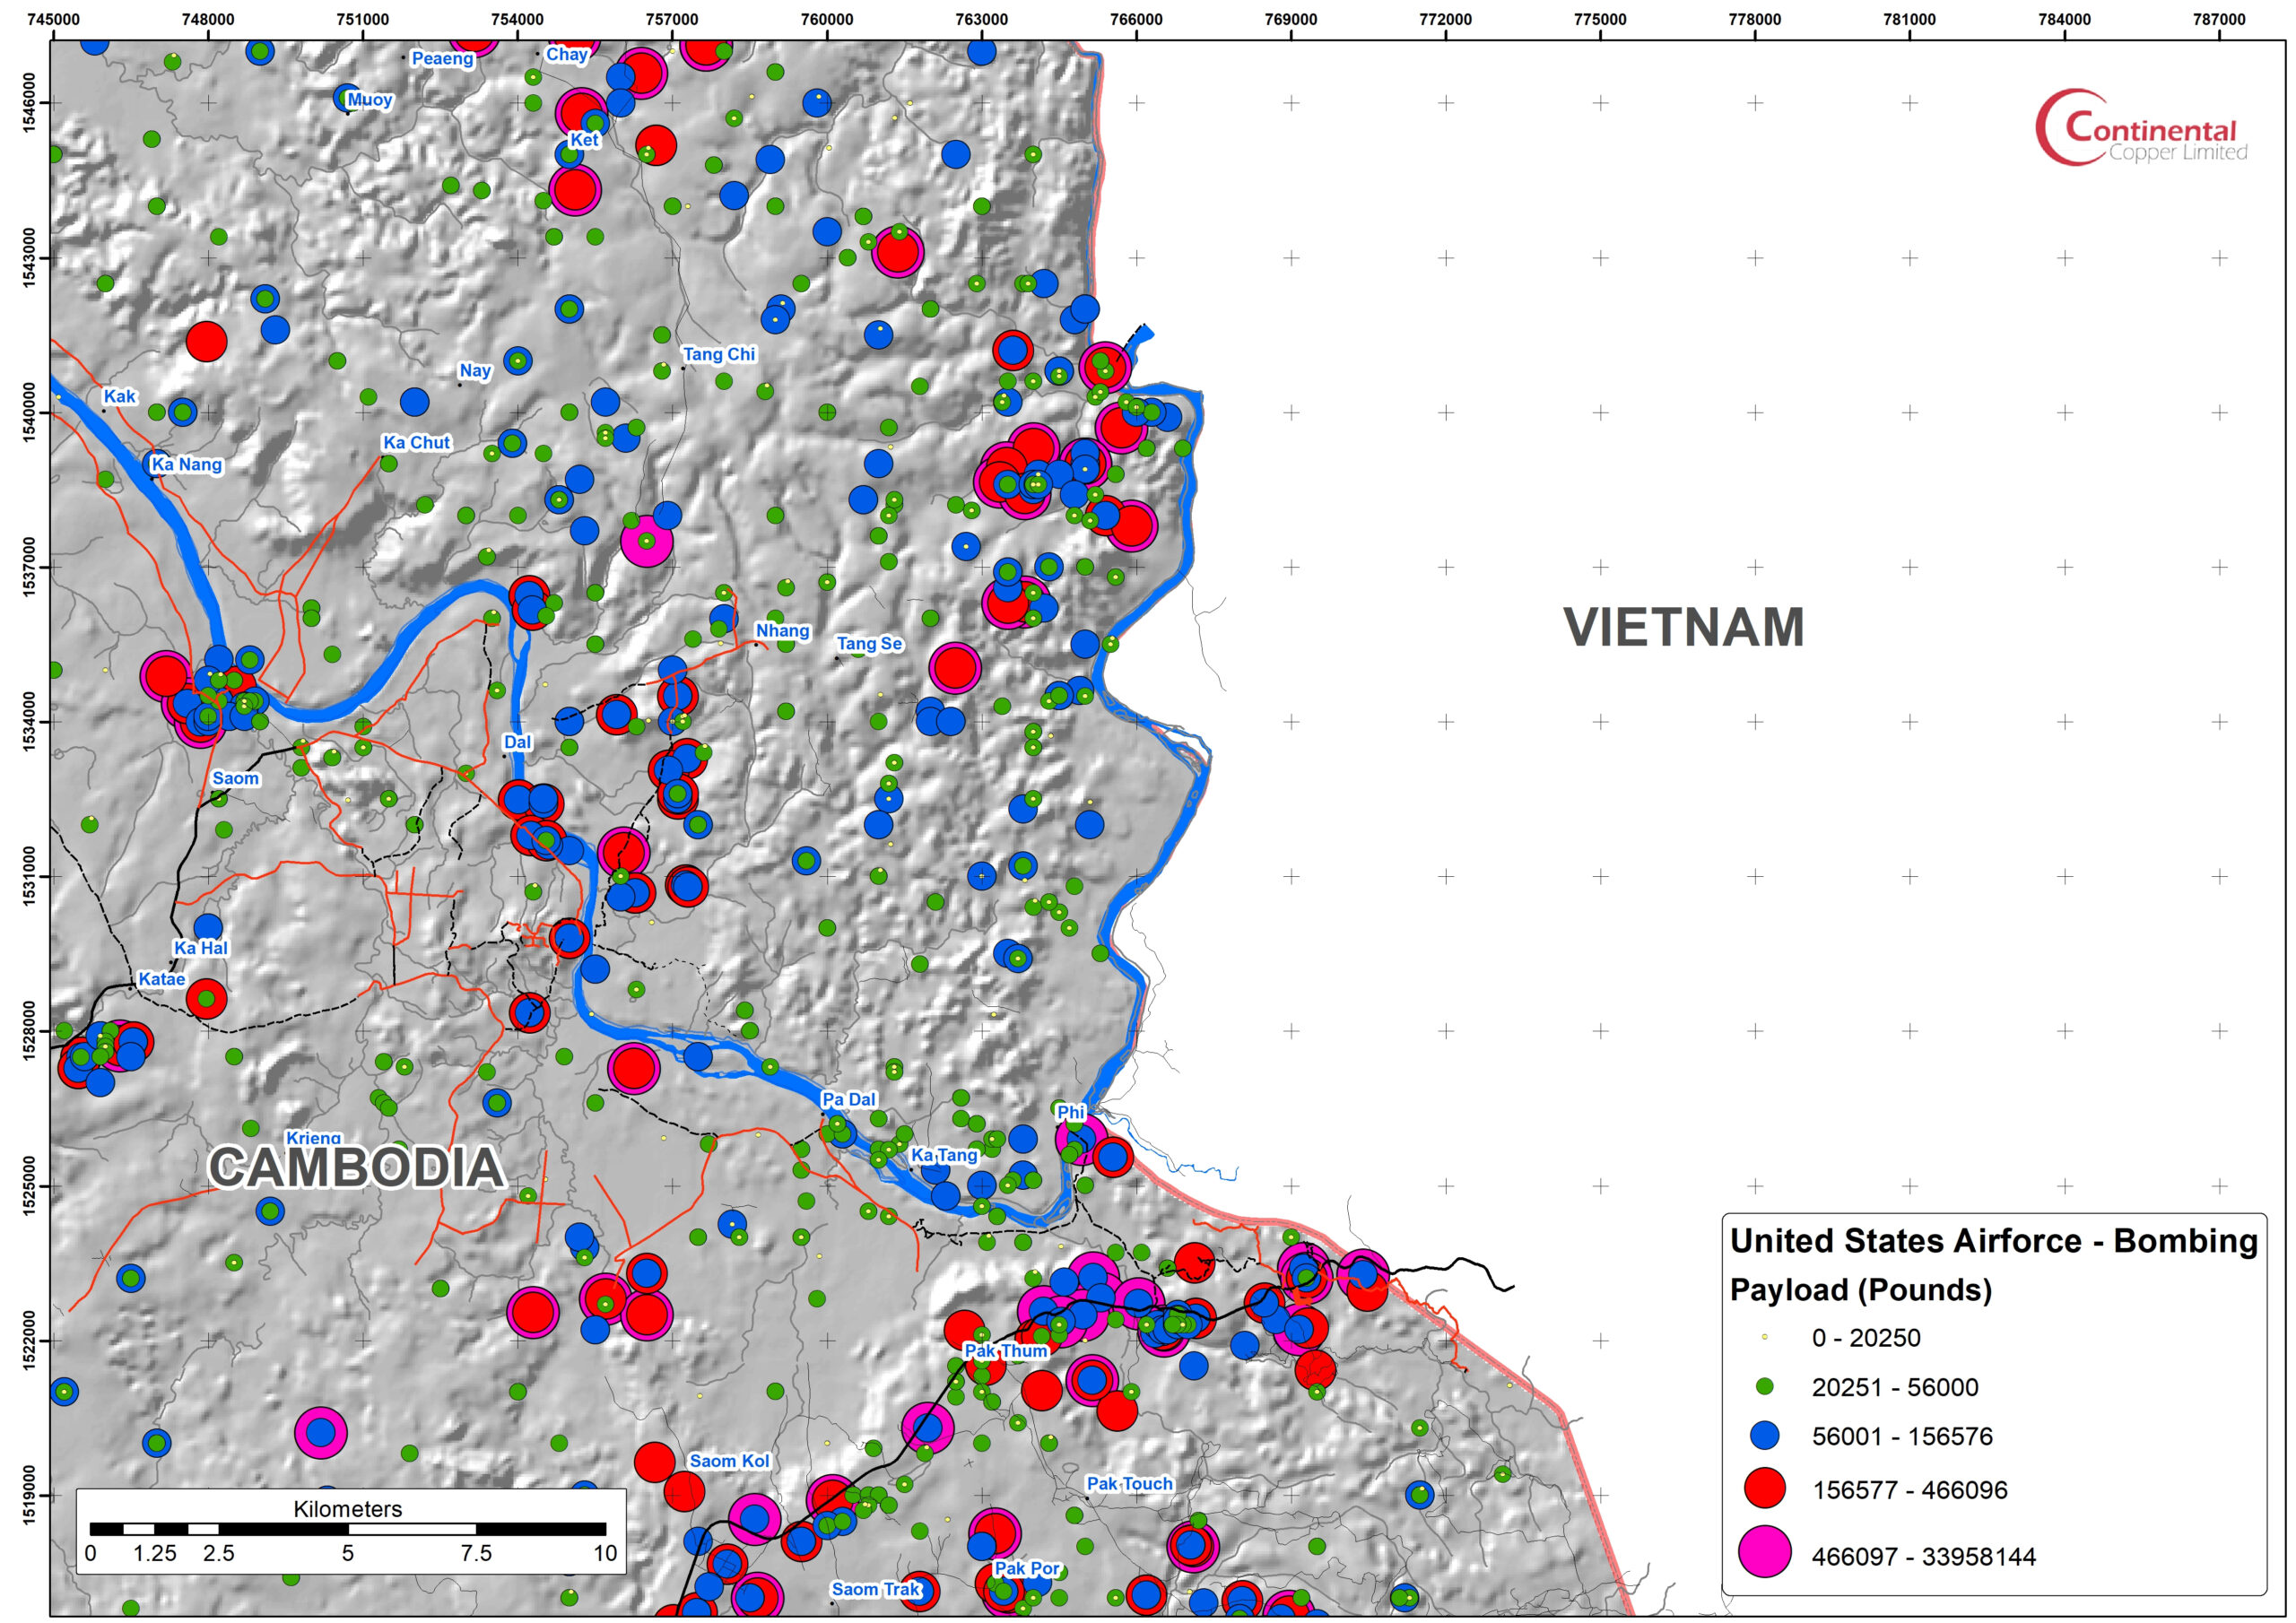
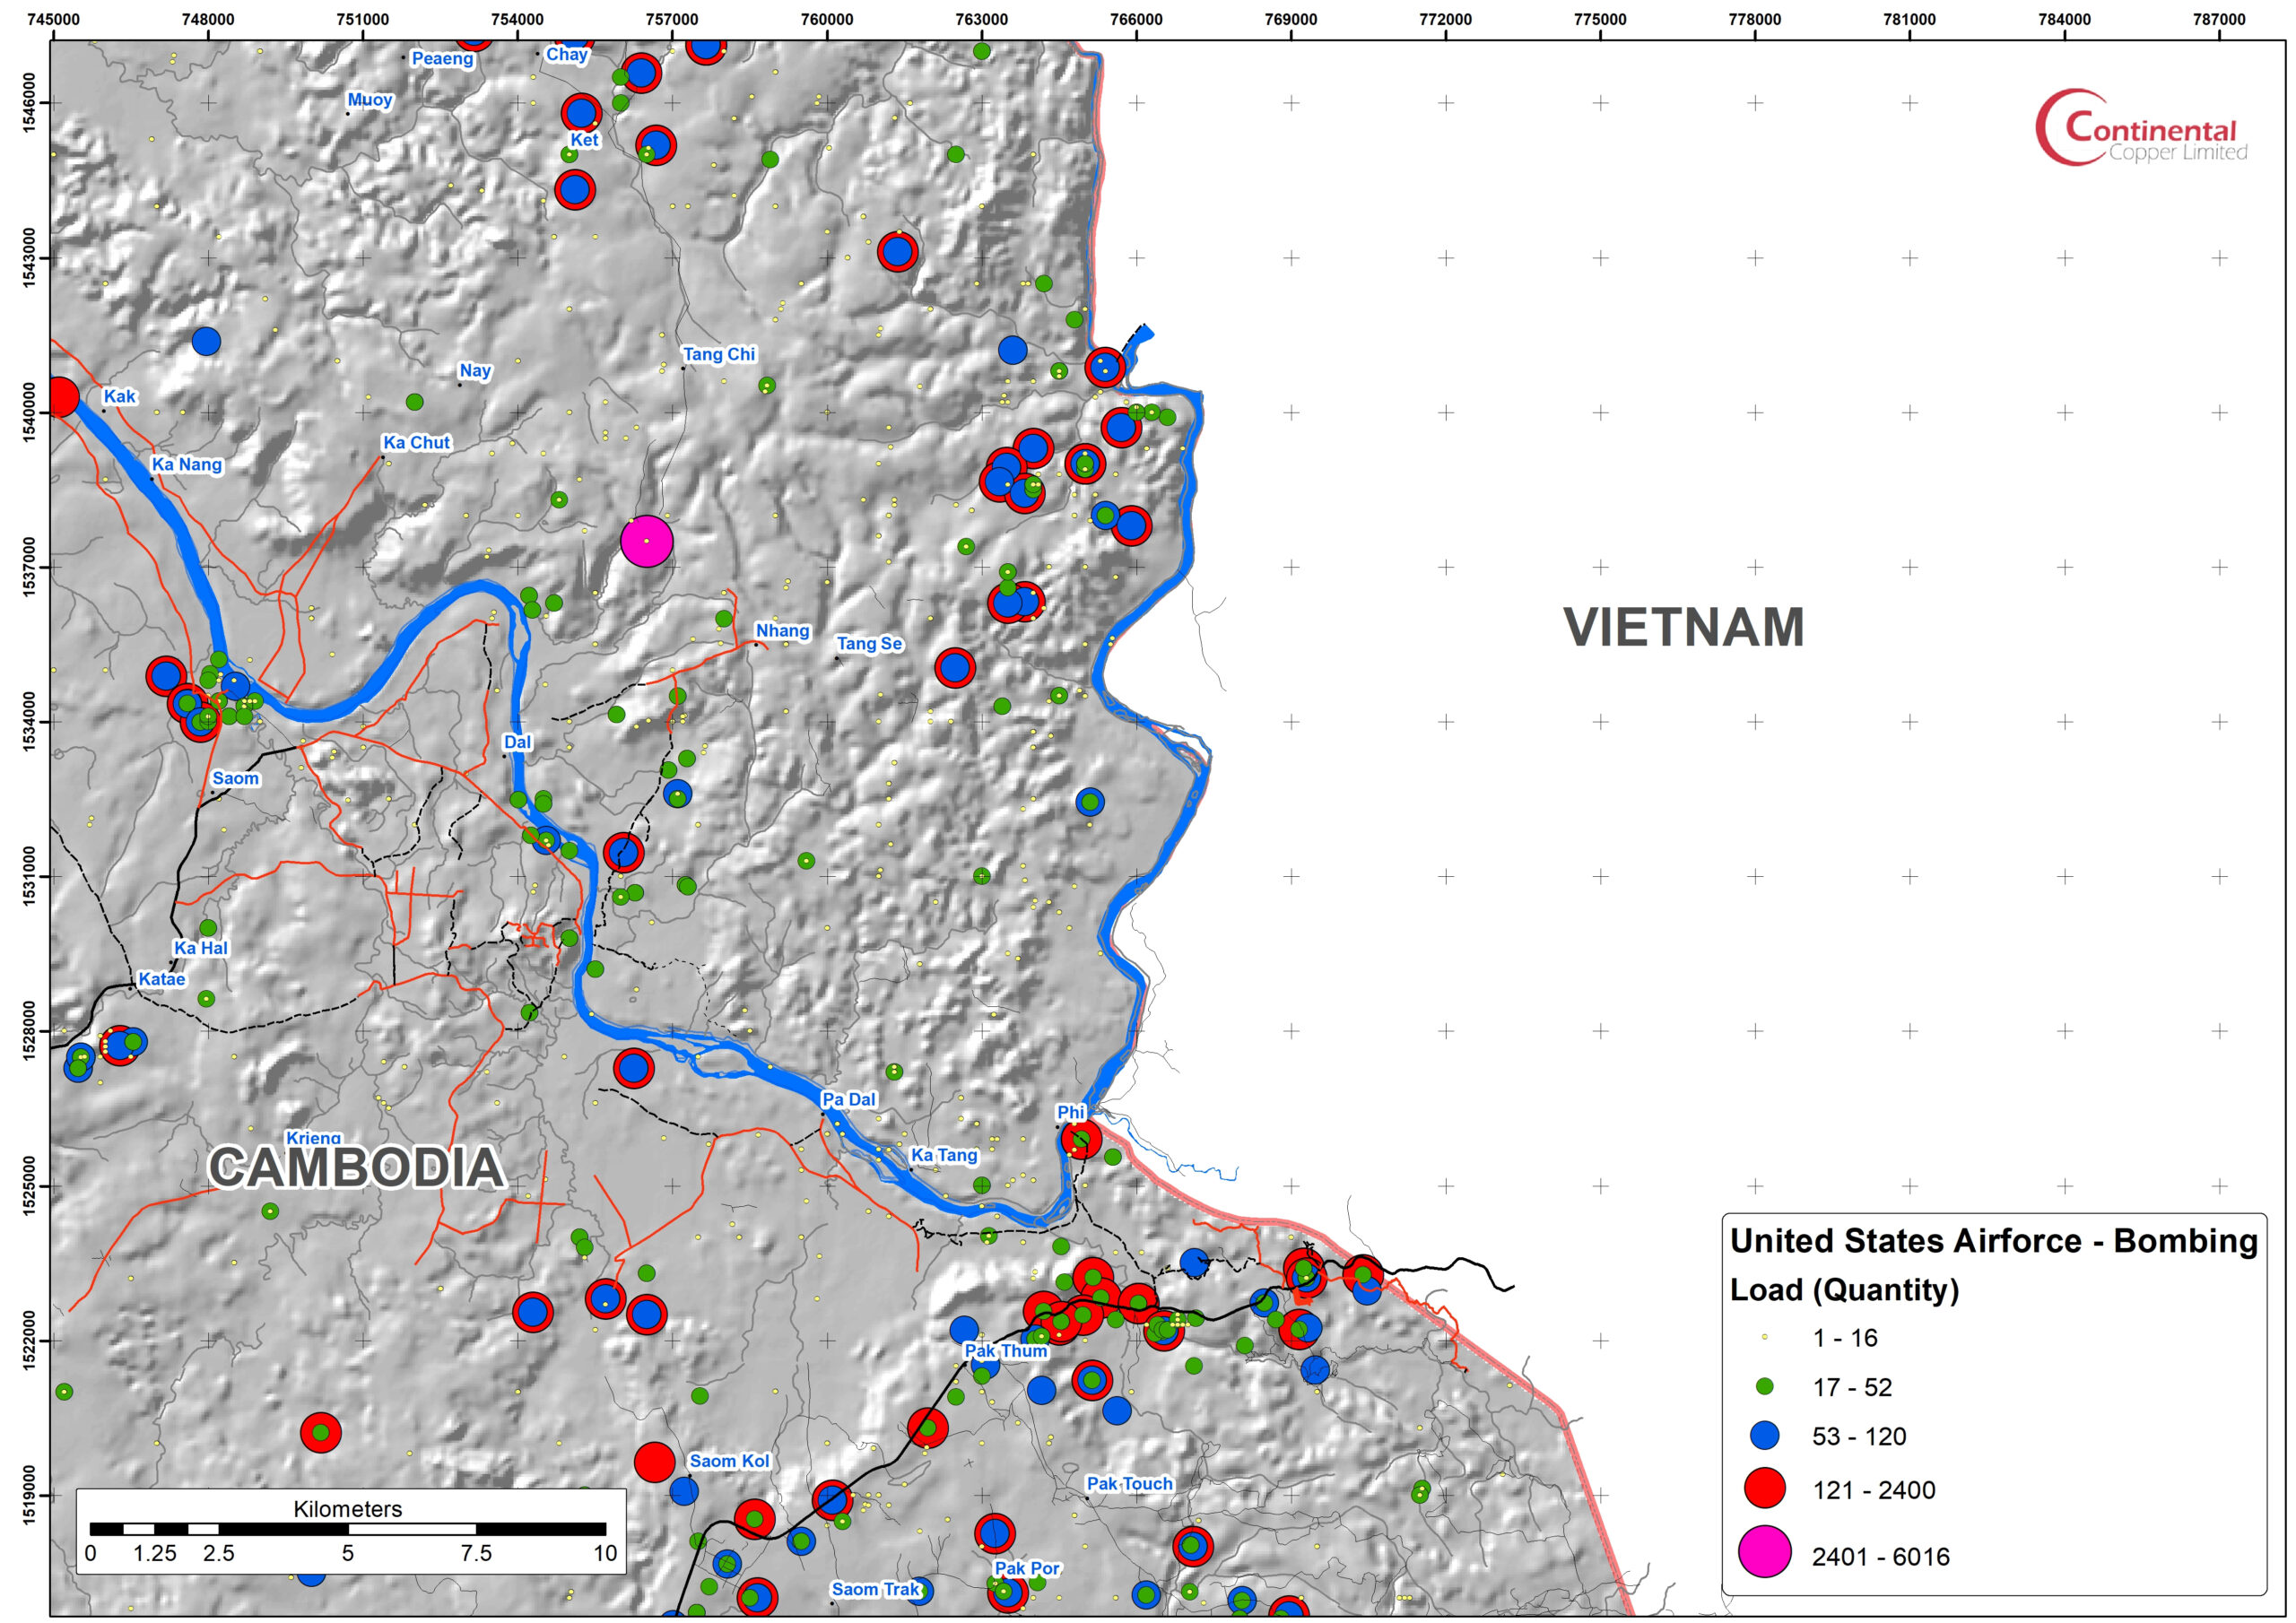
Unexploded ordnance (UXO, sometimes abbreviated as UO), unexploded bombs (UXBs), and explosive remnants of war (ERW or ERoW) are explosive weapons (bombs, shells, grenades, land mines, naval mines, cluster munition, and other munitions) that did not explode when they were employed and still pose a risk of detonation, sometimes many decades after they were used or discarded.
The major contributor to the Cambodian UXO legacy was the aerial bombing campaign conducted by the United States Airforce during the Vietnam War. The most intense bombing was area denial along the Vietnamese border and the extent of this bombing can be see in the following images. The total ordnance dropped was 2.8 Mt (6.1 billion pounds) comprising 2.5 million individual munitions carried in 230,000 sorties.
Land mine clearance organizations include
Third Highest Arctic Sea Ice Extent on 09/02 in the Last 15 Years
February 9, 2020
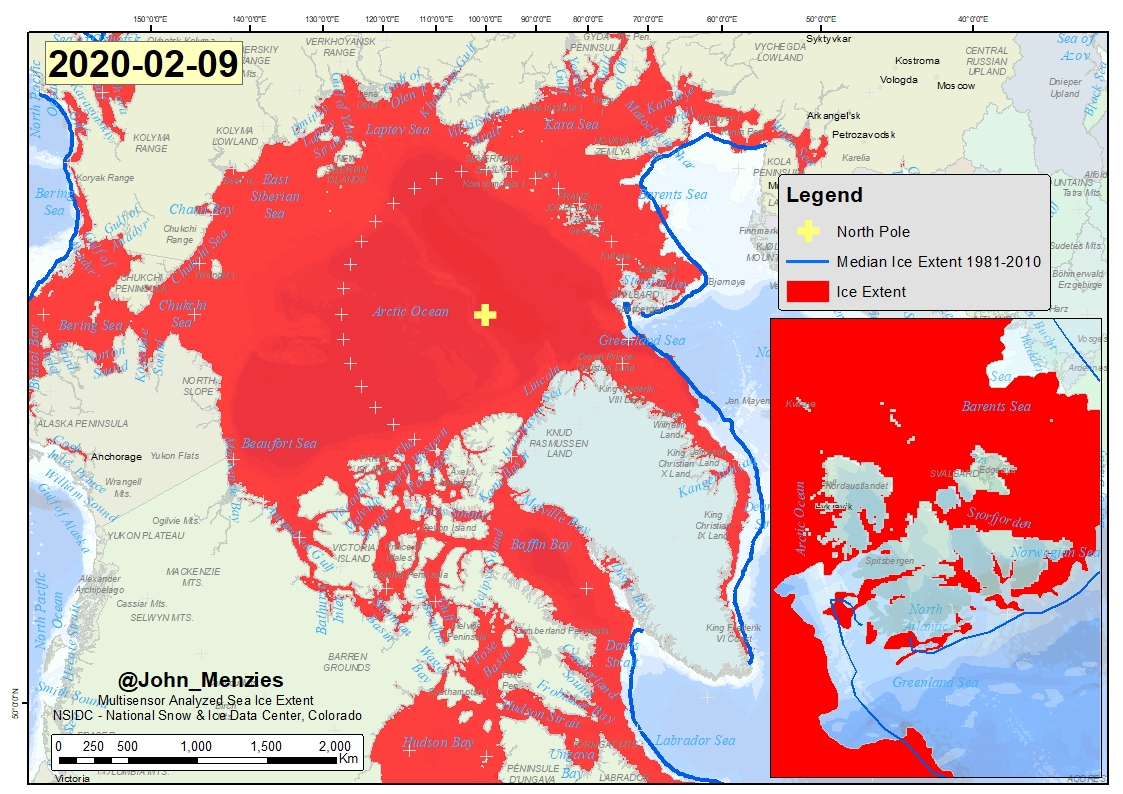
The Arctic sea ice extent is a mere 1.8% less than the 1979-2019 mean and the third highest in the last 15 years.
Mapped Arctic sea ice extent (SIE) on 09/02/2020 was 14.69 million km2 which is 270,000 km2 or 1.8% less than the 1979-2019 average. This is largest sea ice extent on this day since 2009 and is within 1 standard deviation of the 1979-2019 mean ice extent.
The average sea ice accumulation rate in the last 5 days is 50,000 km2/day. The January 2020 rate of sea ice accumulation is the eight highest in the last 40 years and sea ice extent, volume and thickness are not expected to peak until mid-March 2020.
Sea Ice Extent
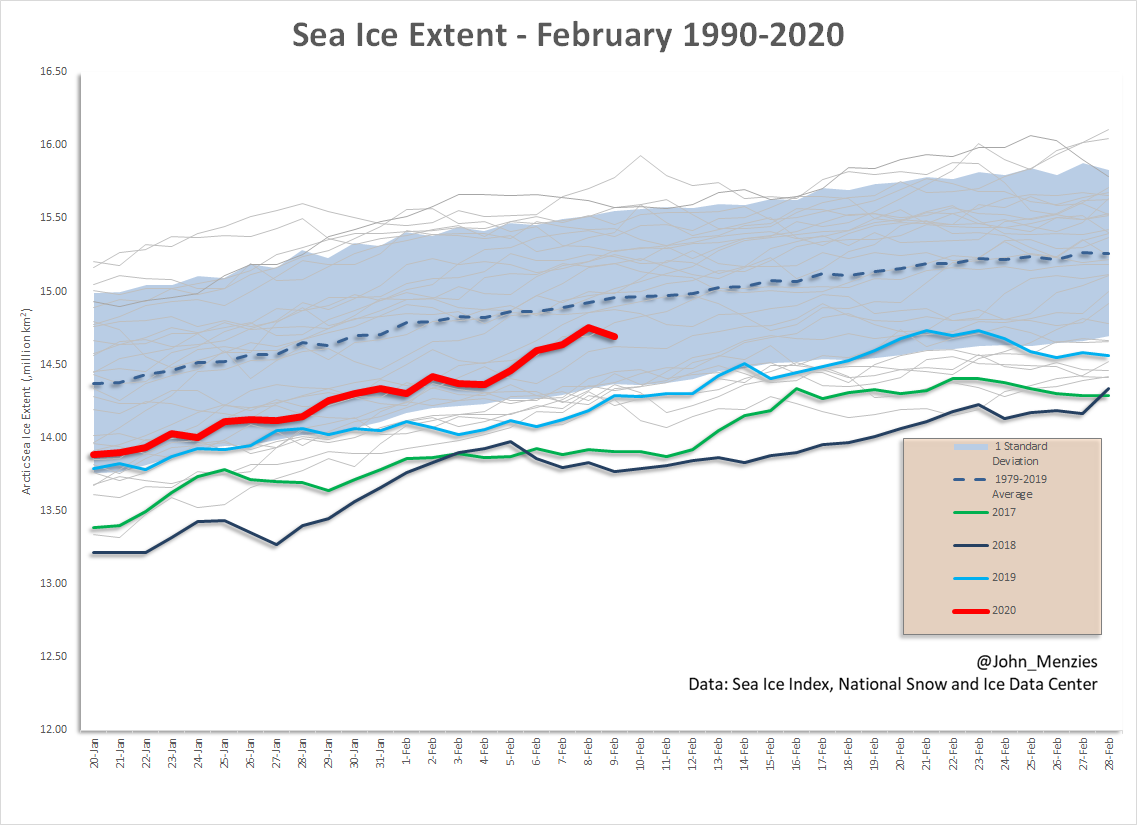
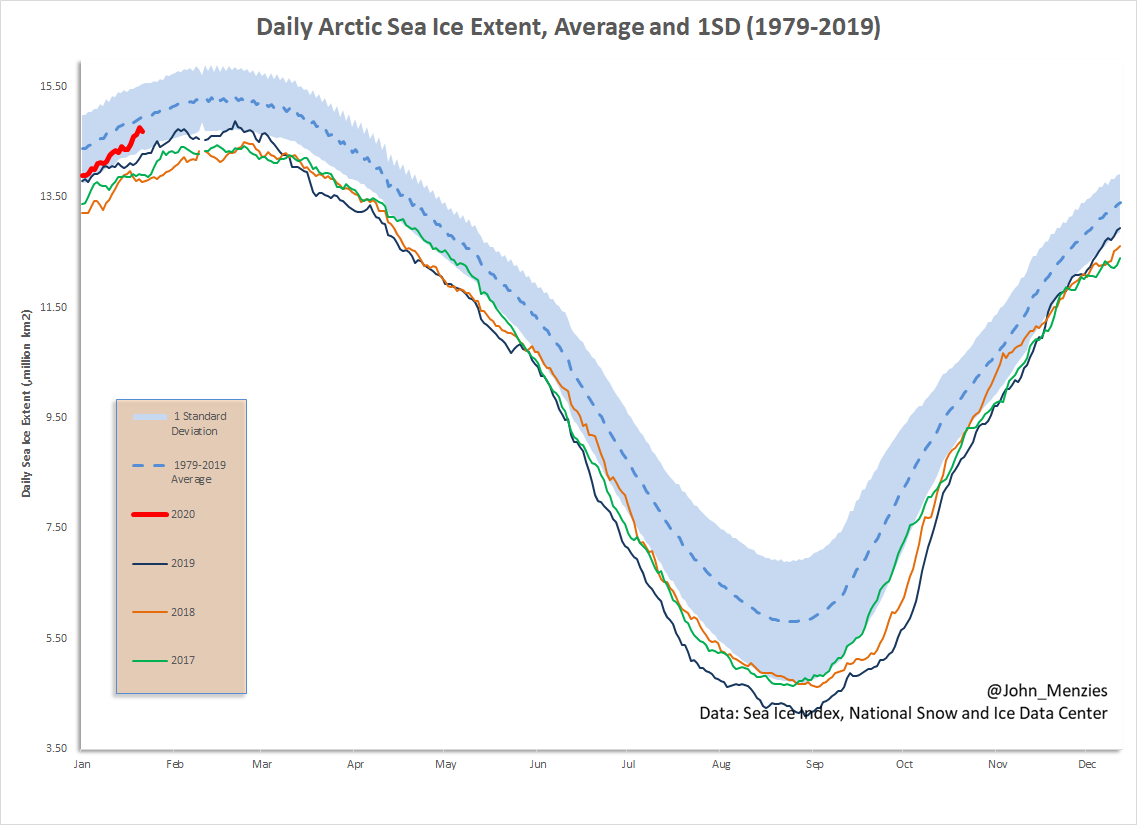
The daily sea ice extent data for February for the period of available data from 1979 to 2020 is shown above. The current sea ice extent is well within the 1 SD of the 1979-2019 average and is the highest since 2009. Arctic sea ice extent shows little trend since 2010.
Arctic sea ice extent is not expected to peak until mid-March 2020.
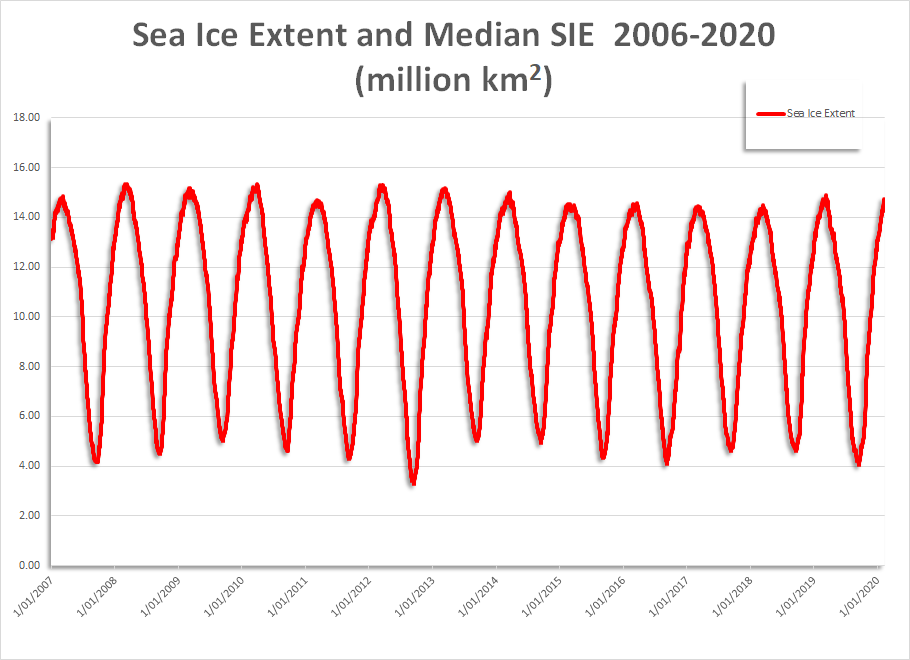
Daily sea ice extent plot for the period 2006 through 2020. Spot the trend!
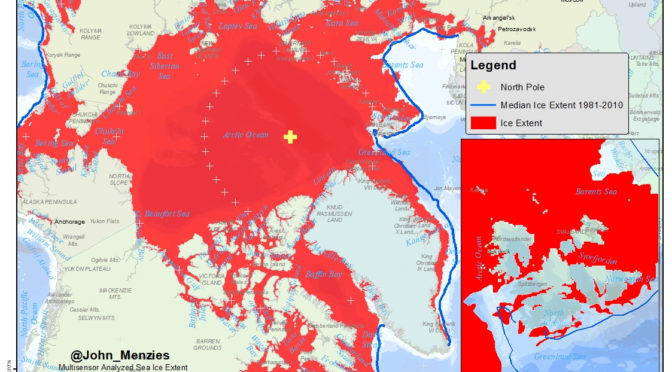
The extent of Arctic sea ice varies from summer to winter. The sea ice extent shown here relies on data from the Multisensor Snow and Ice Mapping System (IMS) that runs at the National Ice Centre. The IMS product uses several satellite data sources including passive microwave, but it is also based on visual analysis and other data sources and undergoes a form of manual data fusion. The data reported here has a 1 km resolution and was sourced from the National Snow and Ice Data Centre
Novel Corona Virus Progression, Reported Rate of Transmission Continues to Slow 09/02/2020
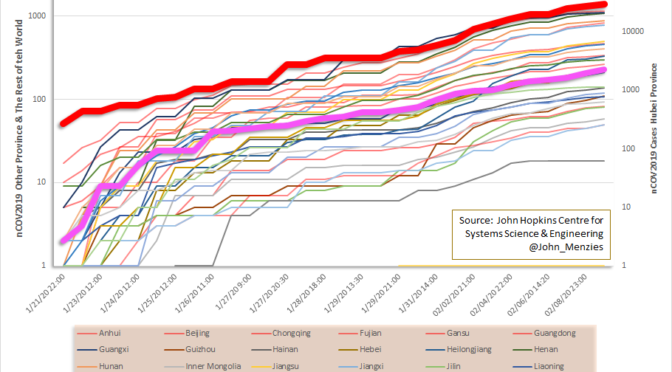
While the Novel Corona Virus (nCOV2019) remains a serious global infection, the media continues to report on nCOV2019 with remarkable ignorance. The common journalistic refrain is now citing increasing numbers of cases with alarm claiming that the infection is accelerating. Based on the reported number of cases, for the moment, little could be further from reality. The reported rate of increase in cases has dropped significantly. With the extended Chinese New Year (CNY) holiday now coming to an end, transmission rates may well now increase as travel resumes. The progression of the disease both inside and outside of China looks remarkably similar excepting in Hubei where it had likely spread well before a new highly infectious virus was recognized. In Hubei the initial reported death rate was high, likely reflecting poor early reporting and a medical system inundated with a large number of cases requiring intensive care.
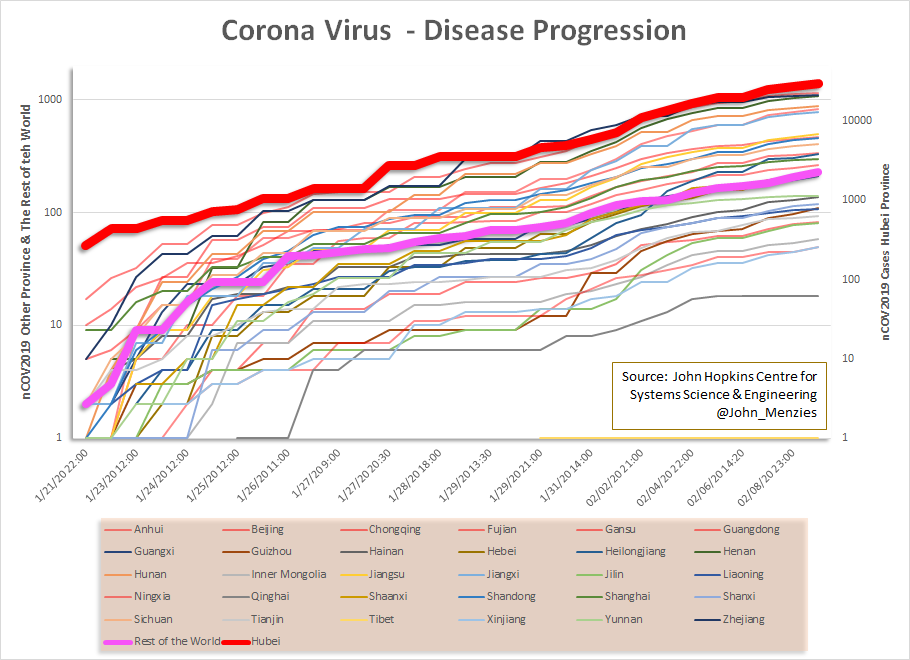
The disease progression for the reported data for all the Chinese provinces and the Rest of the World is shown in the graphic above. The similarity in the slope of disease progression suggests that the data is internally consistent and that commonly discussed under-reporting may not be occurring. The straight-line trends on the log scale simply reflects the logarithmic nature of disease progression for a disease with Ro>1. The chaotic trends at the beginning of the record likely reflects delayed reporting and possibly increased presentation of cases as the public became more aware of the severity of the disease after the 21st January.
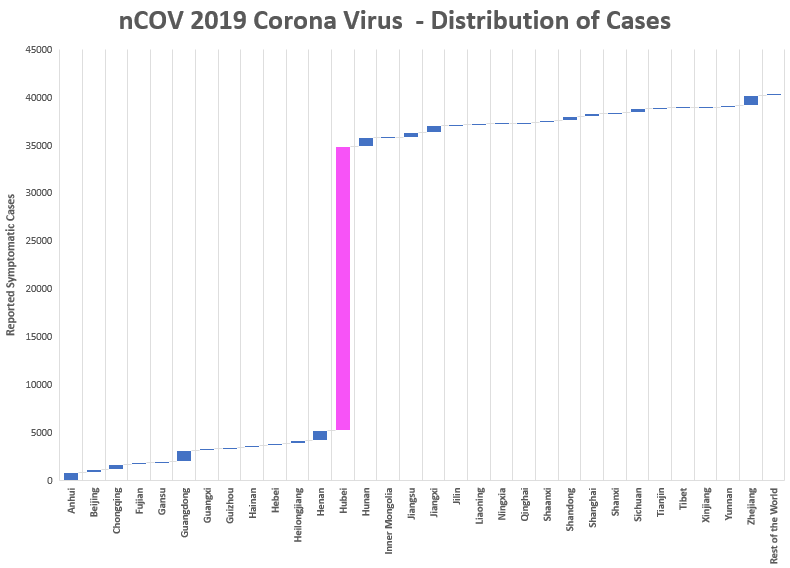
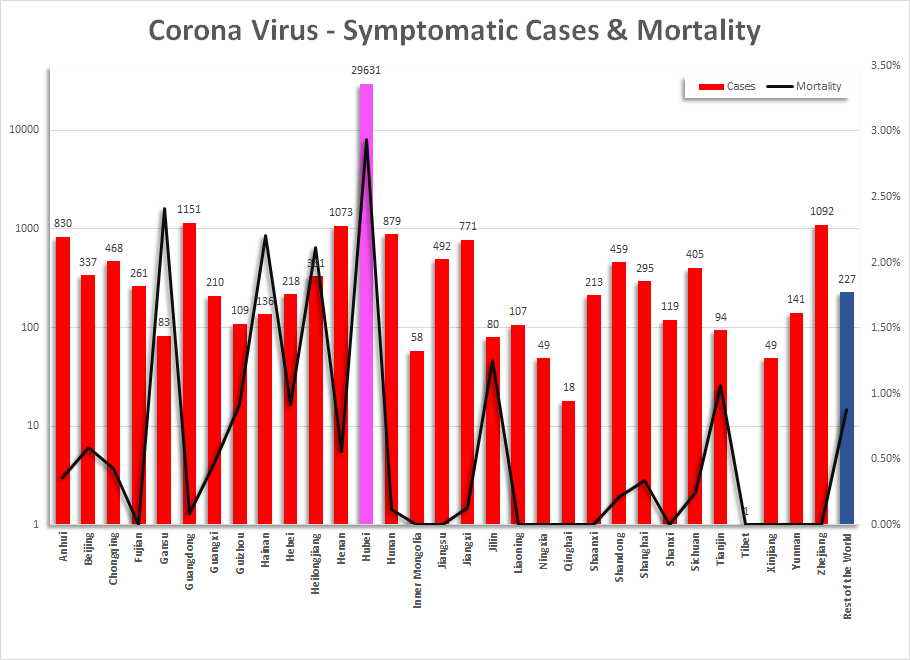
The chart below of the distribution of nCOV2019 cases shows that the majority of cases are reporting in Hebei and supports the decision by the Chinese Government to lockdown not only Wuhan but the entire province.
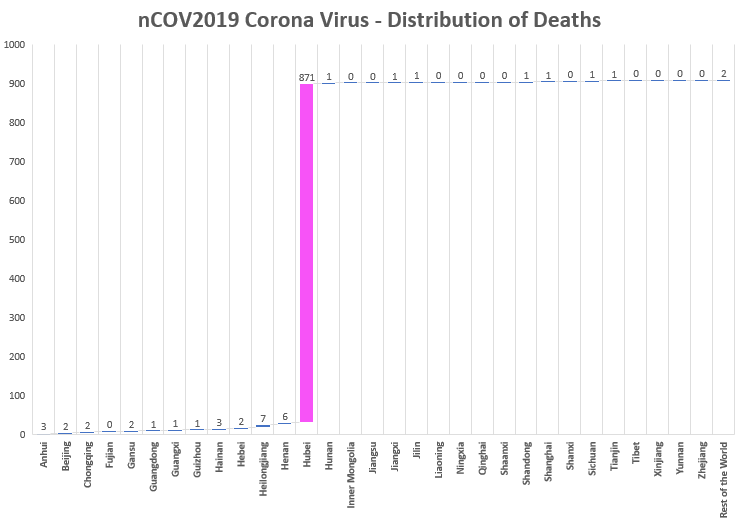
As would be expected the distribution of mortalities is predominantly in Hubei province.
The aggregate mortality rate is shown in the chart below (note the inverted Y-axis). After an initial surge in deaths (which may reflect delayed reporting) in Hubei province the mortality rate has stabilised at 2%, however this average hides some interesting details.
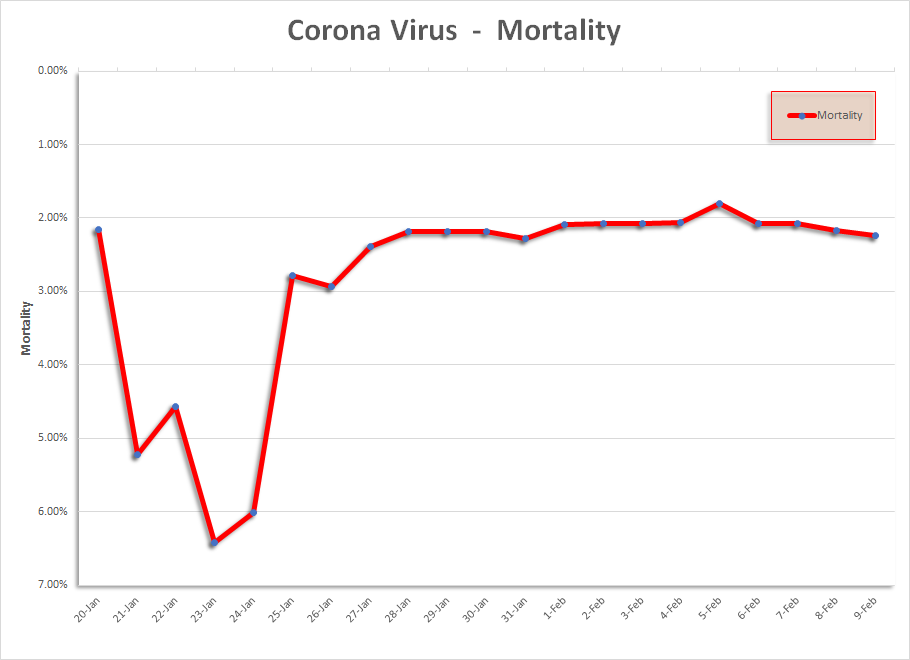
The Mortality Rate varies significantly by region. Mortality in Hubei province was the highest at nearly 3%. This likely reflects the rapid progression of the disease before the appearance of nCOV2019 was recognized and before enough resources could be mobilized. The data also suggests that provinces with better resourced medical facilities were better able to manage patient care. An example of this would be Guangdong compared with Gansu. Guangdong reported more than 10 times the cases of Gansu, however Guangdong reported a mortality rate of 0.9% compared with that of Gansu at 2.4%. There are a number of other comparable comparisons in the data all reflecting likely difference in medical infrastructure.
The mortality data for the rest of the world indicates a death rate of less than 1%. While this data still reflects the earliest days in the disease progression, a number of conclusions can be drawn. nCOV2019 is highly contagious resulting in both viral pneumonia and secondary bacterial pneumonia. A high proportion of patients require hospitalization and oxygen therapy at least for several days. This places considerable strain on these facilities and available oxygen supplies. Were a pandemic to evolve outside China and medical facilities were overwhelmed then comparable mortality to Hubei could be anticipated.
With the end of the CNY and the resumption of travel in china it would seem likely that case numbers may well increase significantly. It is however also likely that many people will stay away from the workplace and remain in the provinces and many businesses many simply close for some time, moderating the impact.
Controlling nCOV2019 both within China and outside will be very challenging, particulalry in countries with poor medical infrastructure. It would seem reasonable that in parts of SE Asia and in Africa nCOV2019 there is a high probability that nCOV2019 will reach pandemic levels. It is also possible that nCOV2019 may be with us for some time, presenting as an annual epidemic until there is sufficient immunity with the global community.
While various experts have commented that surgical masks offer no protection, I would suggest that they are highly effective in keeping hands away from faces, which is likely the main form of transmission. In addition, prudent and regular hand washing should be encouraged and governments should prepare for nCOV2019 by adequately resourcing medical services. It should be remembered that SARS and MERS are both more contagious and more deadly but were successfully contained.