Of recent times all the reporting on Australia has been little more than dire warnings and catastrophic coverage. There is however some positive news on the horizon.
Australia’s climate is determined in large part by three major atmospheric circulatory systems, the Indian Ocean Dipole (IOD) the El Nino – Southern Oscillation (ENSO) and the Southern Annular Mode (SAM) illustrated in the following diagram.

Figure 1 Coupled ocean–climate system in the Indian Ocean region during boreal (solid blue lines) and austral (dashed red lines) summer. Credit Cleverly, J., et al 2016
Indian Ocean Dipole
Within the northern Indian Ocean there is a major atmospheric circulation system which determines much of the weather patterns that impact Australia. A regular oscillation of sea surface temperatures (SST) occurs in the Indian Ocean and is known as the Indian Ocean Dipole (IOD) and is comparable to the better-known ENSO of the Pacific Ocean. The IOD results in SSTs becoming alternately warmer in the west and cooler in the east along the Western Australian coastline (warmer phase) and then colder in the west and warmer in the east (the negative phase).
A positive phase sees greater-than-average sea-surface temperatures and greater precipitation in the western Indian Ocean region, with a corresponding cooling of waters in the eastern Indian Ocean—which tends to cause droughts in adjacent land areas of Indonesia and Australia. The negative phase of the IOD brings about the opposite conditions, with warmer water and greater precipitation in the eastern Indian Ocean, and cooler and drier conditions in the west. This results in increased monsoonal activity in the NE Indian Ocean and increased injection of moisture into the Australian atmospheric system.
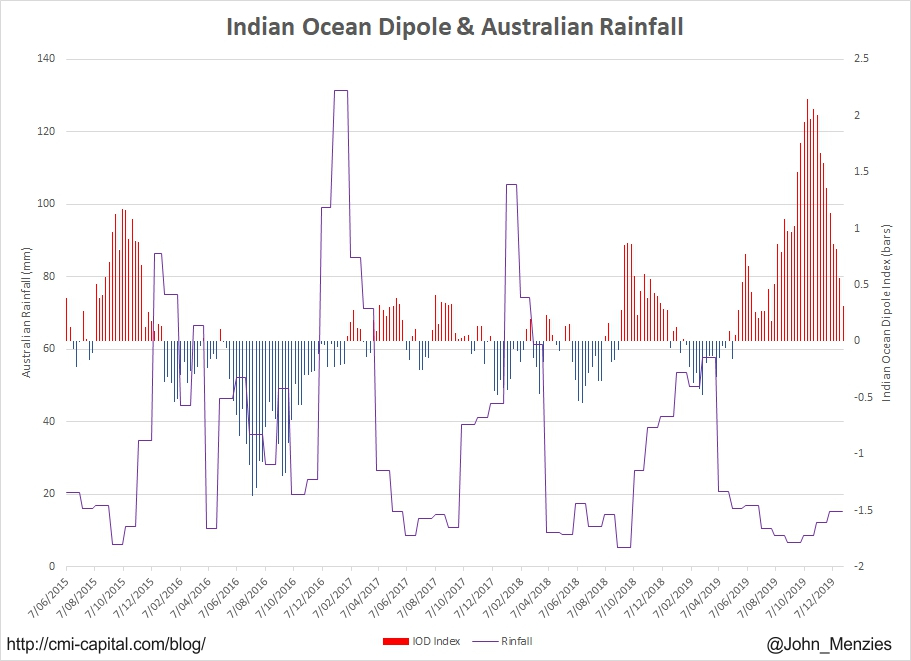
The strong IOD experienced during the first half of 2019 and the neutral ENSO and negative SAM created the very dry conditions which results in record low precipitation in Australia for 2019. Since October the IOD has fallen rapidly and while the BoM suggests that it will remain neutral it is equally likely that it will become strongly negative resulting in increased injection of moistures into the Australian atmospheric system later in 2020.

Figure 2 Australian Rainfall and Indian Ocean Dipole Index (Data after BoM)
El Nino – Southern Oscillation
El Niño and La Niña are the warm and cool phases of a recurring climate pattern across the tropical Pacific—the El Niño-Southern Oscillation, (ENSO).
The pattern can shift back and forth irregularly every two to seven years, and each phase triggers predictable disruptions of temperature, precipitation, and winds. El Niño describes a particular phase of the ENSO climate cycle when sea surface temperatures in the central and eastern tropical Pacific Ocean become substantially warmer than average, and this causes a shift in atmospheric circulation. Typically, the equatorial trade winds blow from east to west across the Pacific Ocean. El Niño events are associated with a weakening, or even reversal, of the prevailing trade winds. Warming of ocean temperatures in the central and eastern Pacific causes this area to become more favourable for tropical rainfall and cloud development. As a result, the heavy rainfall that usually occurs to the north of Australia moves to the central and eastern parts of the Pacific basin producing drought conditions in Australia.
In the Pacific Ocean, although indicators of the El Niño–Southern Oscillation (ENSO) are neutral, the tropical ocean near and to the west of the Date Line remains warmer than average, potentially drawing some moisture away from Australia.
Southern Annular Mode
The Southern Annular Mode, or SAM, is a climate driver that can influence rainfall and temperature in Australia. The SAM refers to the (non-seasonal) north-south movement of the strong westerly winds that blow almost continuously in the mid- to high-latitudes of the southern hemisphere as an annulus around Antarctica. This belt of westerly winds is also associated with storms and cold fronts that move from west to east, bringing rainfall to southern Australia.
The SAM has three phases: neutral, positive and negative. Each positive or negative SAM event tends to last for around one to two weeks, though longer periods may also occur. The time frame between positive and negative events is quite random, but typically in the range of a week to a few months. During summer a positive SAM can result in increased rainfall in SE Australia while during winter a positive SAM will see lower rainfall in Southern Australia and a negative SAM will allow more cold fronts to impact southern and SW Australia. In recent months SAM has moved from negative to neutral.
Forecast for January
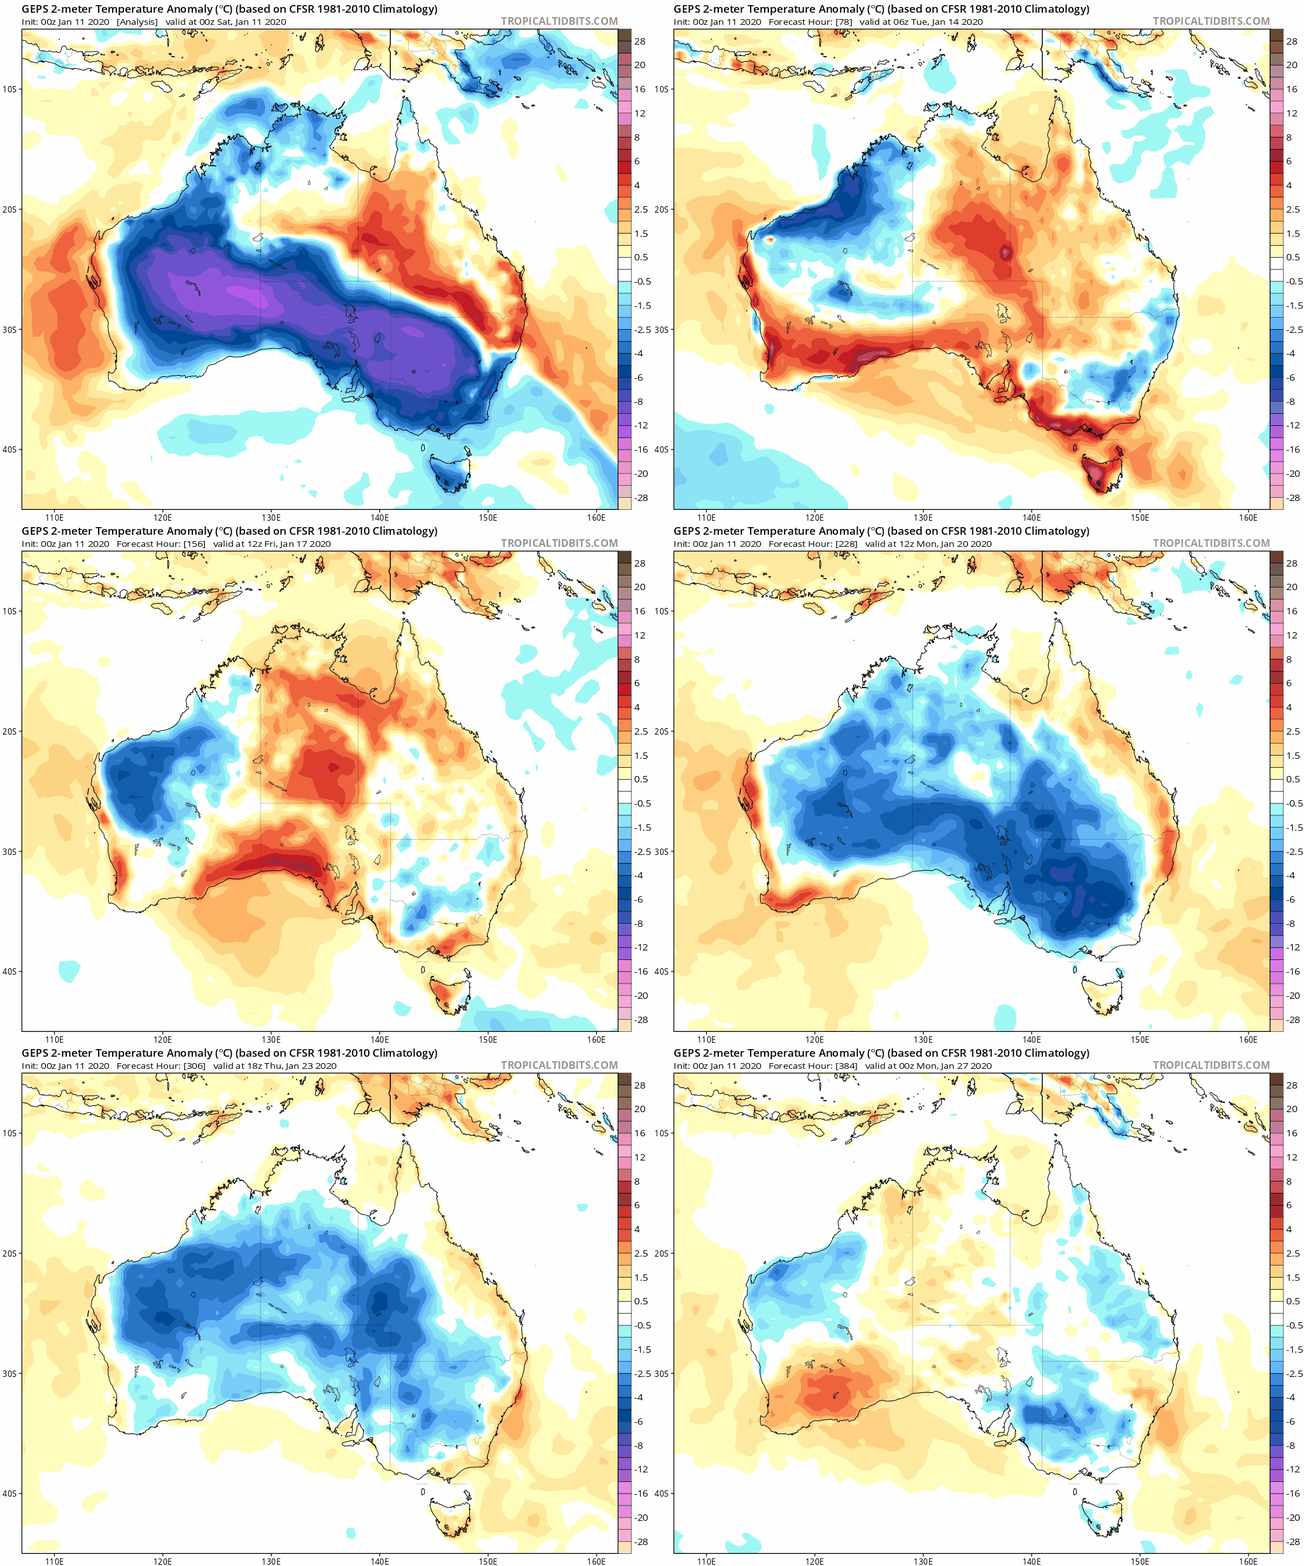
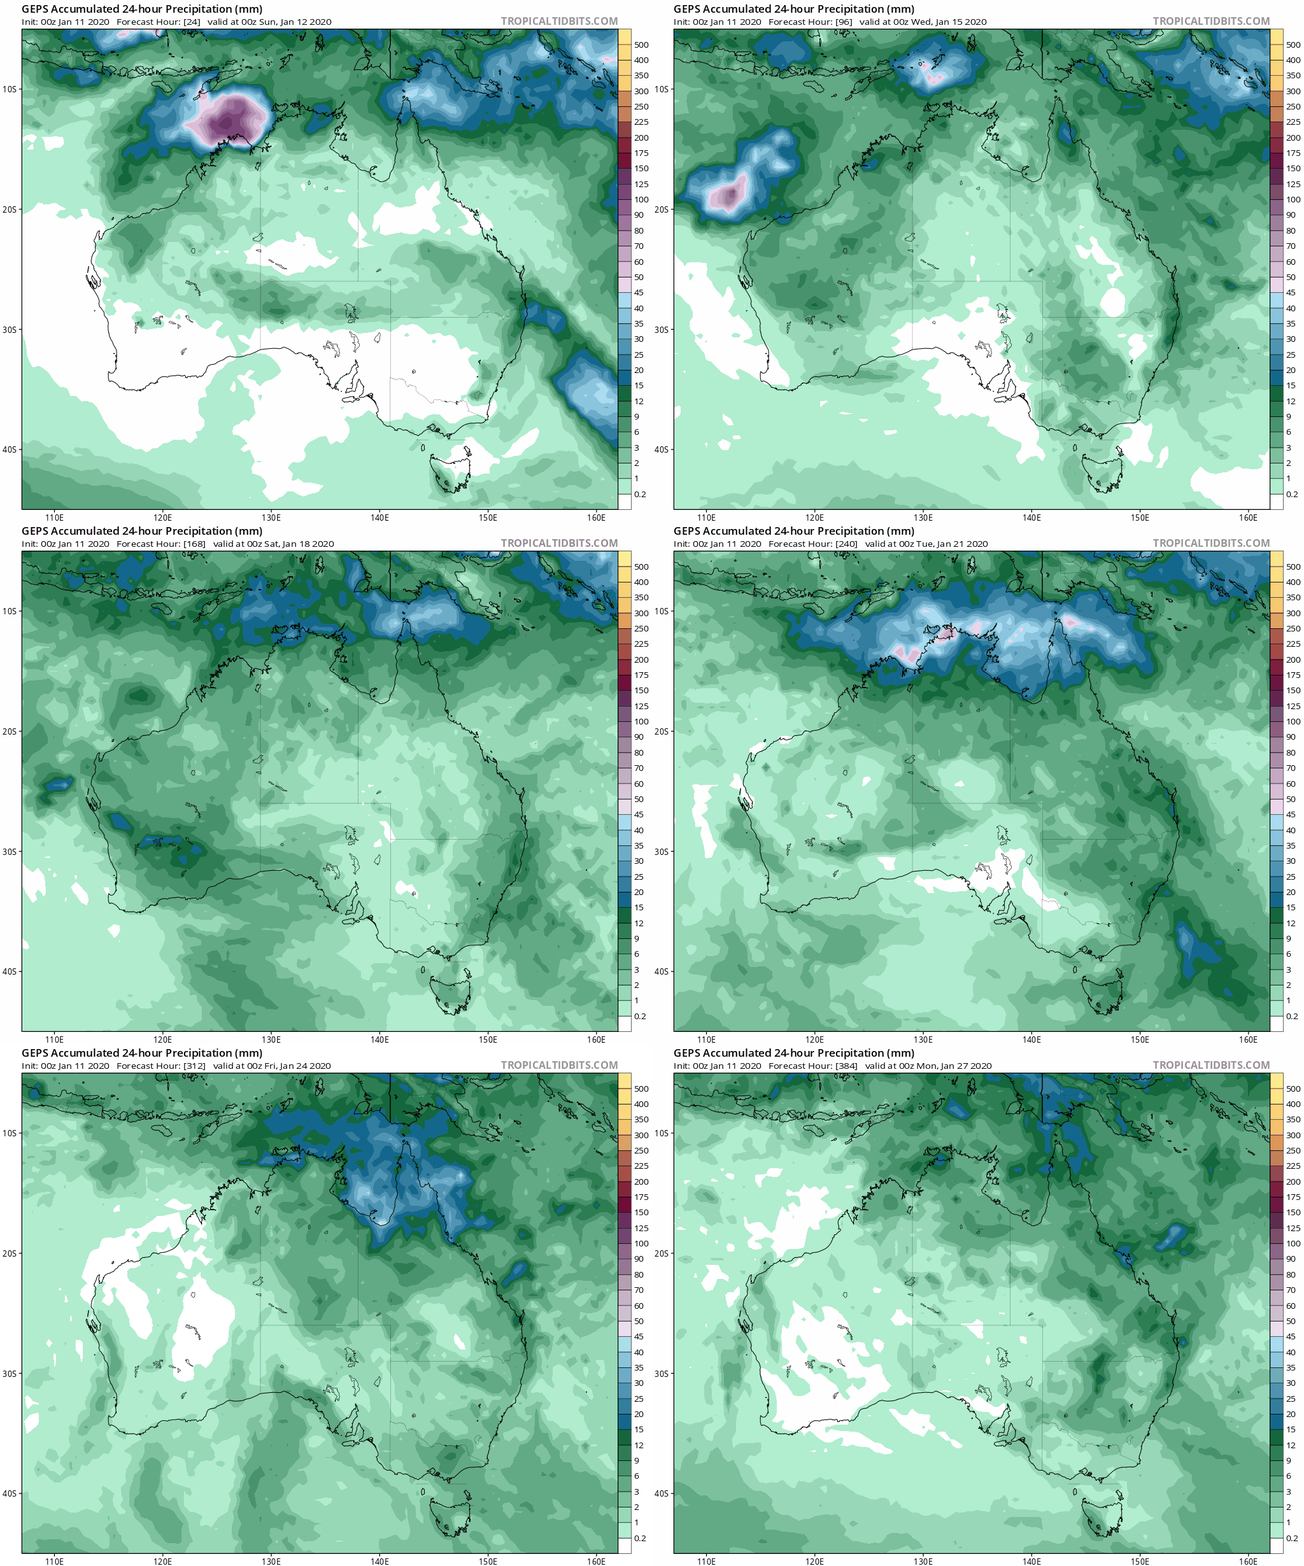
The Global Ensemble Prediction System (GEPS) is an ensemble product of the Global Environmental Multiscale Model, an integrated data assimilation and forecasting system that runs for 16 days (384 hours). The graphics below shows the GEPS 2m temperature and precipitation output from 12th to the 28th January at 6-hour time intervals.
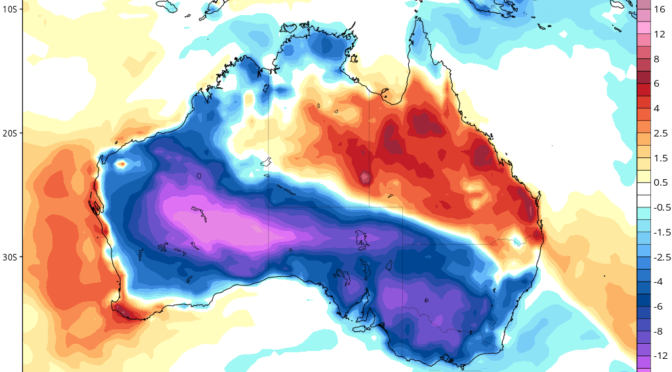
The GEPS model suggests that large areas of southern Australia should experience temperatures consistently below the seasonal average (by as much as 20C) but with little significant precipitation. Some rain in the WA wheat belt and subsequently in eastern states is predicted as tropical cyclone, Claudia, develops into a rain depression off the coast. Precipitation typical for northern Australia in summer is noted.

Figure 2 GEPS 2m Temperature Model for Australia through January 28th

Figure GEPS Precipitation model for Australia through January 28th
