The Mount Isa Province in northern Australia is one of the world’s most prospective regions for minerals. It hosts three of the ten largest Zn–Pb deposits in the world, the world-class sediment- hosted Mount Isa copper deposit, and the Ernest Henry IOCG.
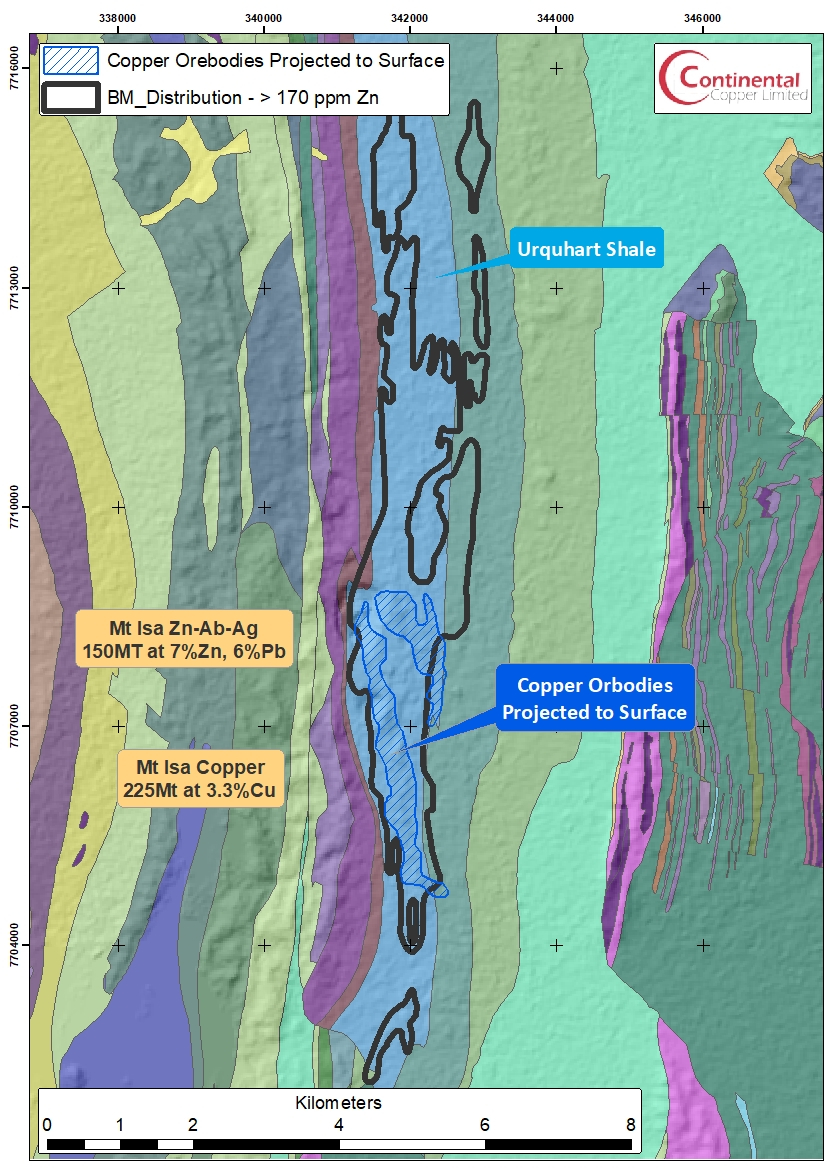
The Mount Isa copper (225 Mt at 3.3% Cu) and zinc-lead-silver ore (150 Mt at 7% Zn and 6% Pb) deposits are hosted within the Mesoproterozoic (1653 Ma) Urquhart Shale, an around 1000 m thick succession of carbonaceous, pyritic, dolomitic siltstone that belong to the Mt Isa Group, which lies within the Leichhardt River Fault Trough, and belongs to Calvert Superbasin in the Western Fold Belt of the Mt Isa Inlier.
At Mount Isa Mine, the Pb-Zn-Ag orebodies occur in the upper 650 m of the Urquhart Shale, in a zone extending 1.6 km along strike and 1.2 km down dip. The gross geometry of the ore lenses is one of progressive migration up-sequence to the N, although individual sulphide bands within each ore lens closely follow bedding. At their southern and down dip extremities, the Pb-Zn-Ag orebodies interfinger with lobes of ‘silica-dolomite’, the collective term for the bedding-replacive, vein and breccia mass of dolomite and quartz that hosts the Cu orebodies (Perkins, W.G., 1984).
Economic Cu ore occurs beneath the Pb-Zn-Ag ore system, at vertical depths of 1000-1800 m towards the base of the Urquhart Shale (viz., the 3000-3500 Cu ore system), and extends more than 2 km southwards at vertical depths of 700-1200 m (viz., the 1100 Cu orebody).
Data and Presentation
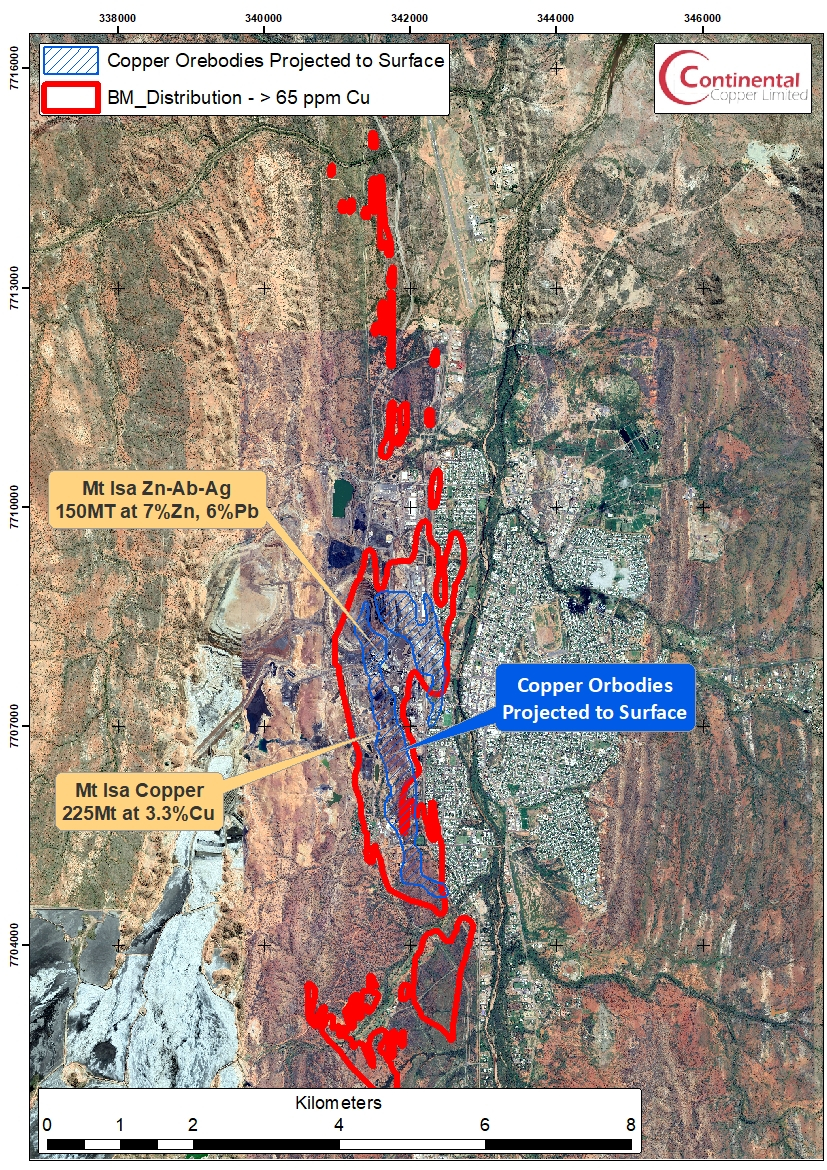
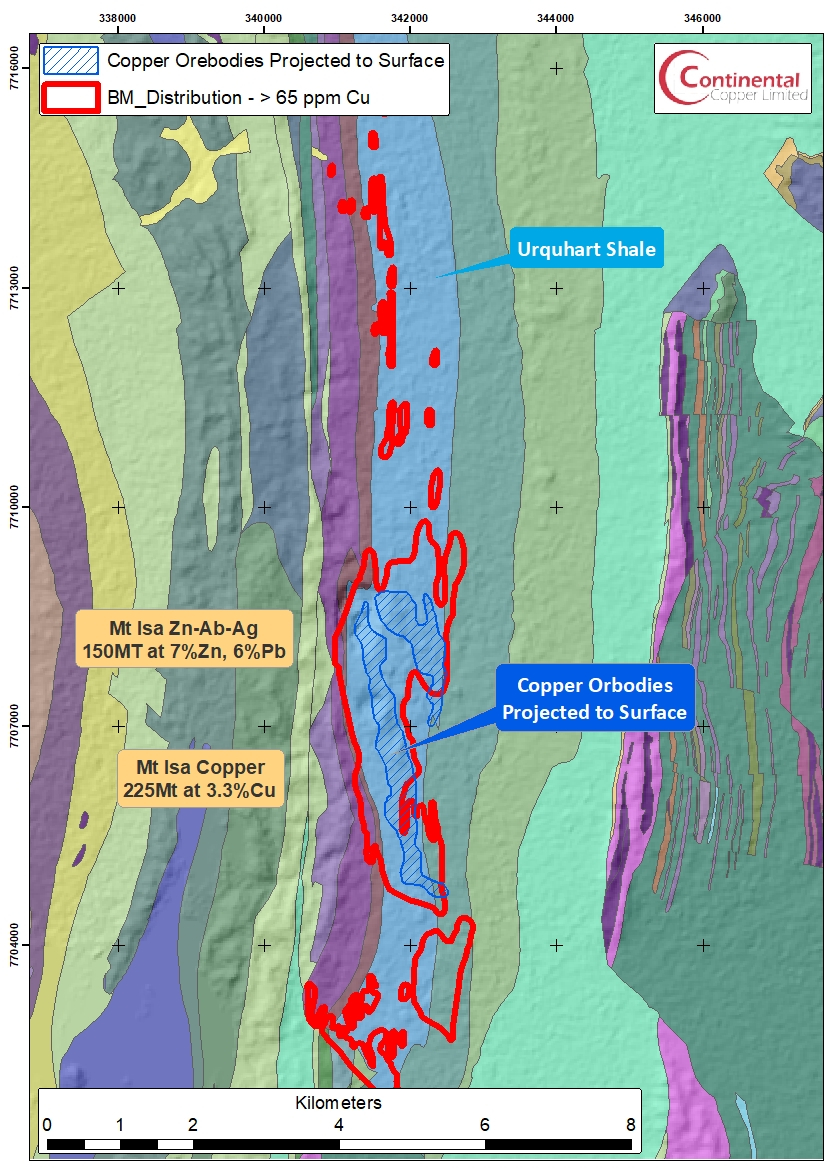
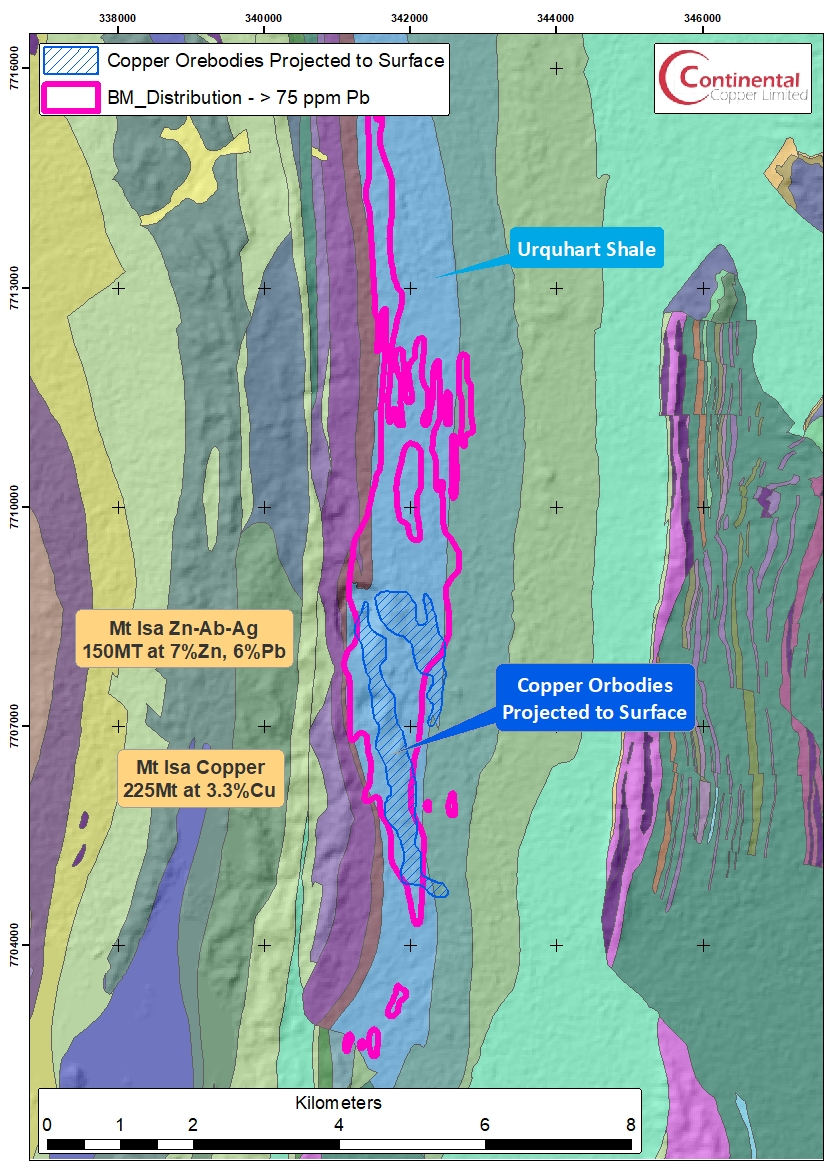
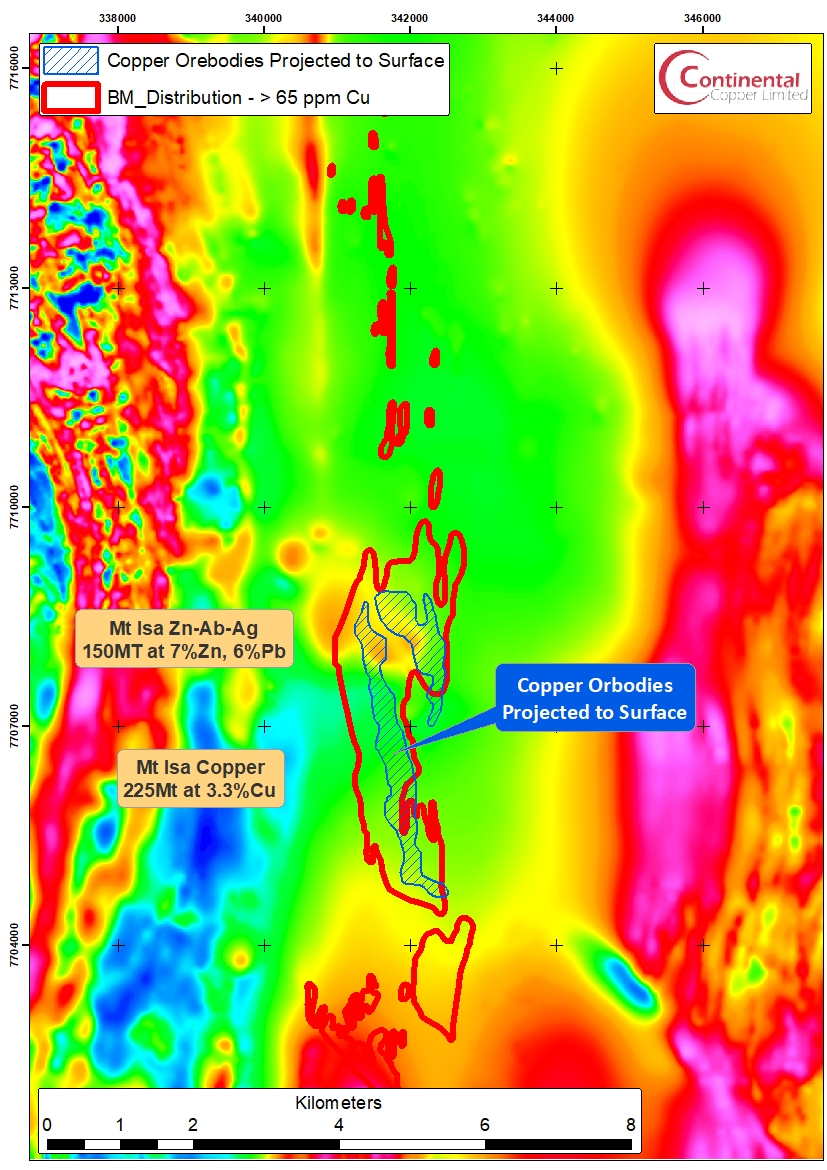
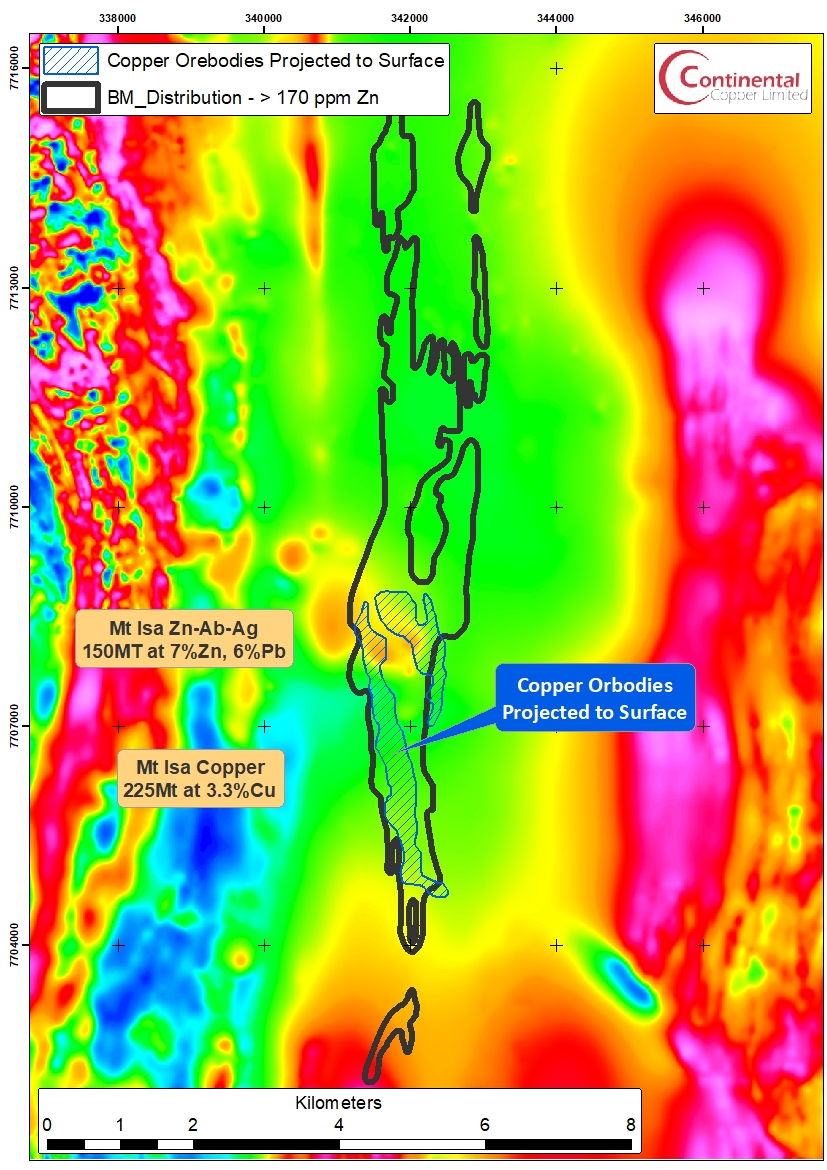
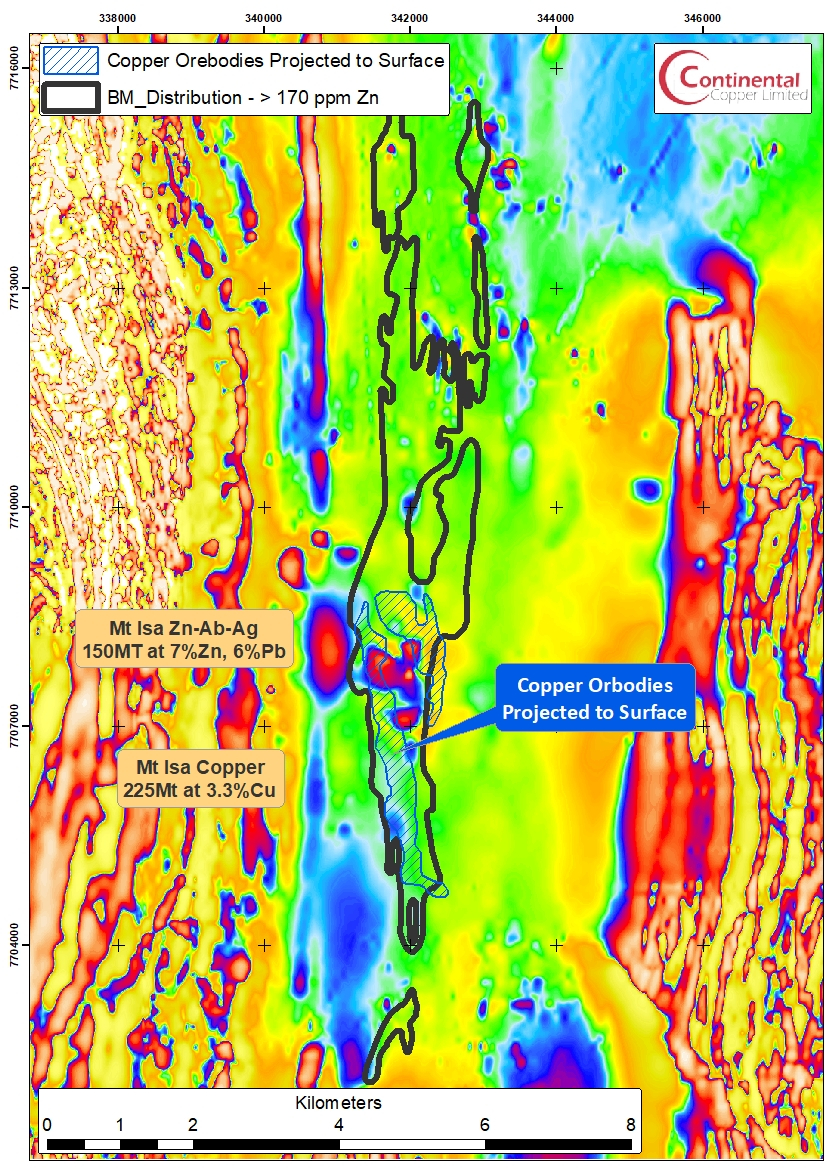
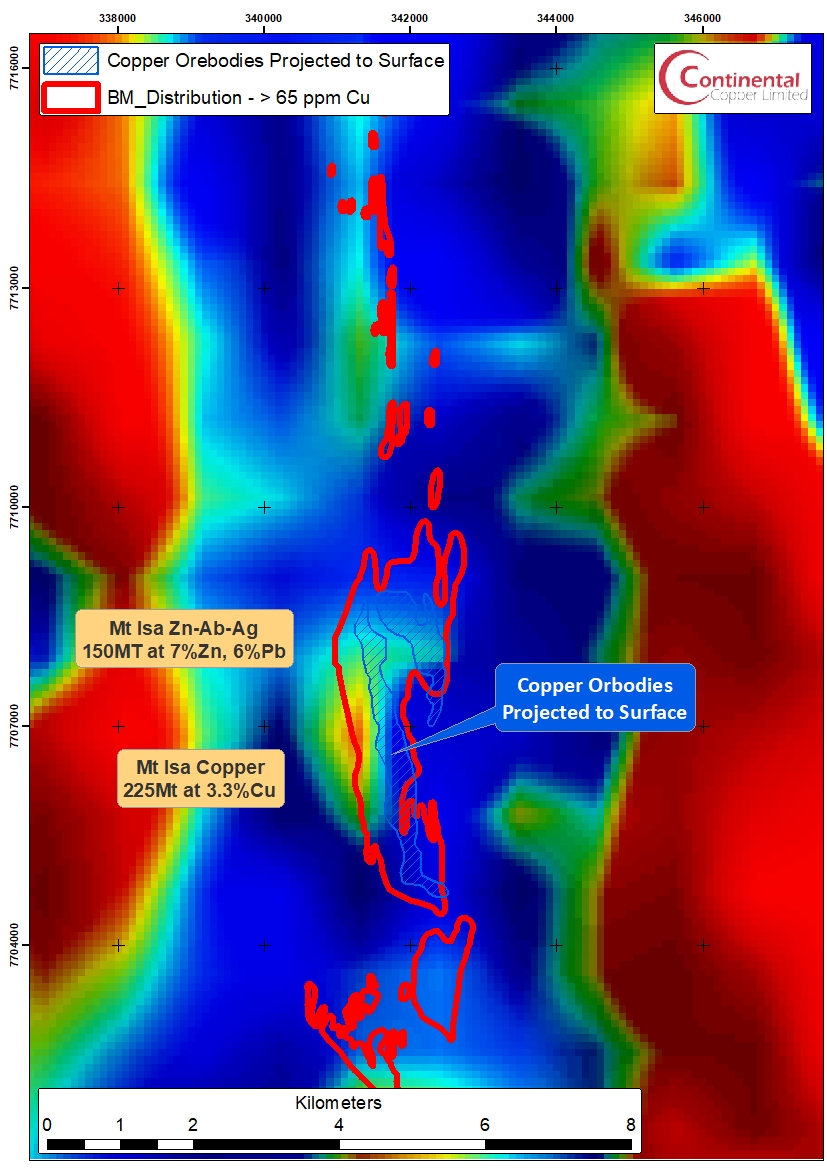
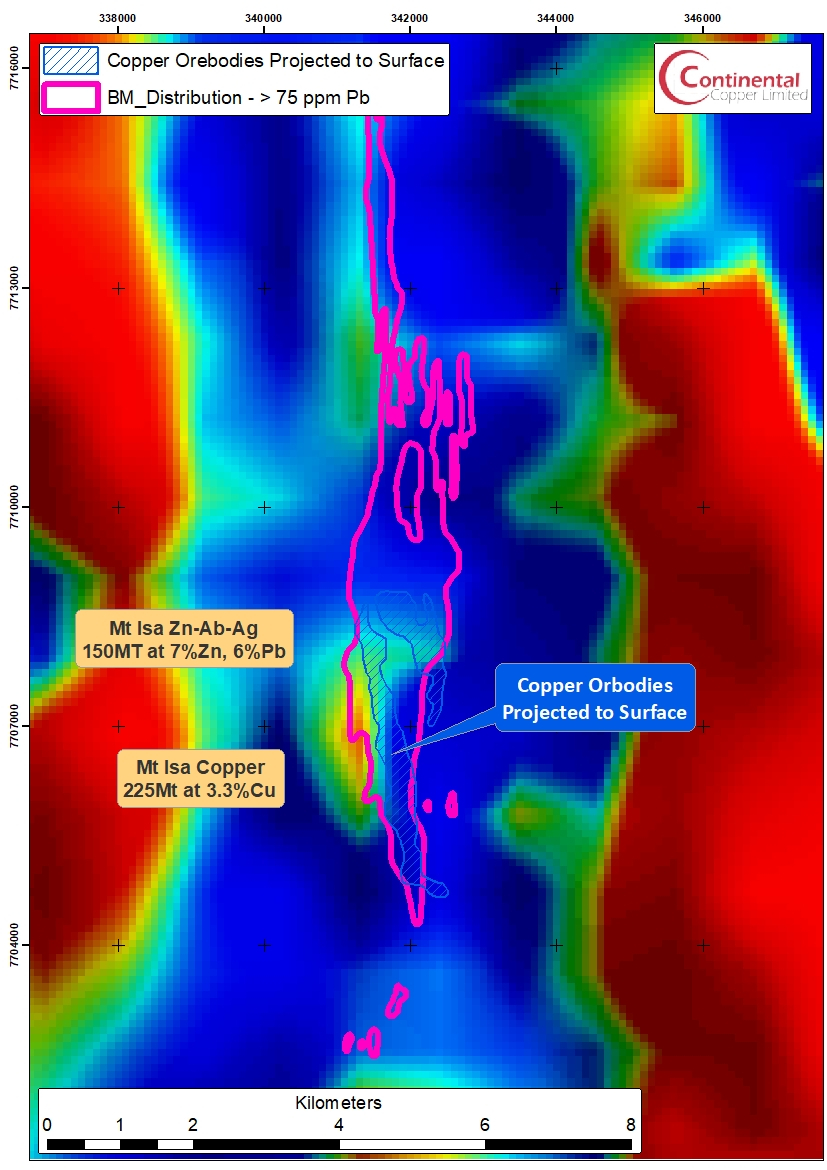
Conaghan, E.L., Hannan, K.W. & Tolman, J. 2003 used a sizeable geochemical database of drillhole (diamond and RAB) and soil sample data to generate maps of Cu, Pb and Zn over much of the strike of the Urquhart Shale. Most of the samples were collected during the 1980s from saprolite or saprock at depths of 3-10 m to avoid the effects of more than 30 years of contamination from ore and concentrate stockpiles and smelting operations. Although the contours are locally schematic and extrapolated across areas of significant infrastructure, they are based on sufficient data to demonstrate the extent of primary base metal dispersion above the ore deposits.
Conaghan et. al. 2003 report that fresh Urquhart Shale in outcrop and RAB samples (outside the immediate mine area) reported Cu, Pb and Zn background values of 30, 25 and 45 ppm respectively. Samples were from visibly unmineralized rock and reported maximum Cu, Pb and Zn or 250, 1000 and 2000 ppm respectively.
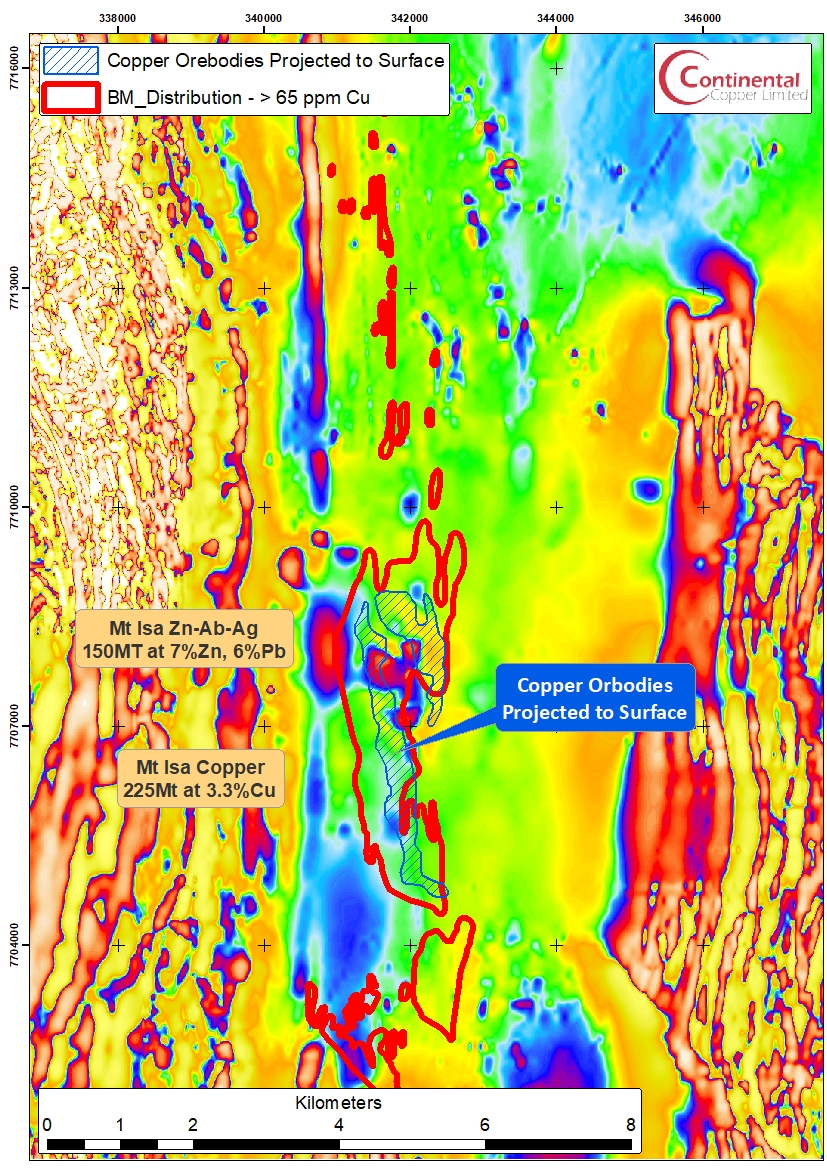
The gravity and magnetic data are as compiled by the Geological Survey of Queensland.
Summary
This post is a compilation of geophysical and geochemical data with the aim of better understanding the signature of these major deposits at a regional scale. In summary, the economic mineralization which has been mined over a strike of ~4km is hosted within Cu, Pb and Zn anomalies which extend for ~12km. The mineralization, at a regional scale does not exhibit significant magnetic or gravity anomalies. The magnetic anomalies at Mt Isa are most likely related to the significant infrastructure developed at the mine and within the city of Mt Isa. The gravity anomaly is most likely related to the Pb-Zn gossans which outcrop. There is only limited publicly available electrical data, due to the presence of cultural interference, but given the large amount of pyrite associated with the mineralization an undeveloped Mt Isa would have large and high-order IP, EM and MT anomalies.
Bedrock Geology
Magnetics

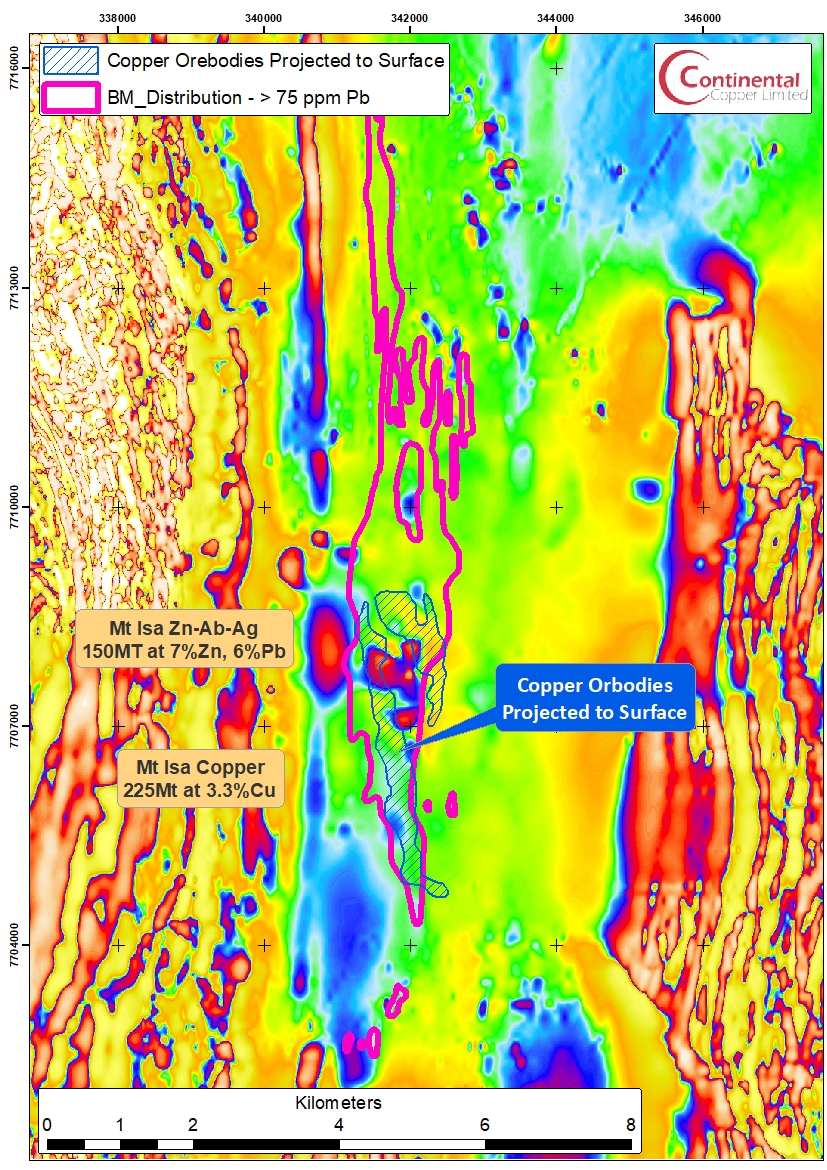
Gravity

References
Conaghan, E.L., Hannan, K.W. & Tolman, J. 2003. Mount Isa Cu and Pb-Ag-Zn deposits of NW Queensland, Australia. Regolith Expression of Australian Ore Systems, CRC LEME Geochemistry Special Monograph Series. 3pp
Perkins, W.G., 1984. Mount Isa Silica Dolomite and Copper Orebodies: The results of a Syntectonic and Hydrothermal Alteration System. Economic Geology, 79: 601-637.
2 thoughts on “A Giant Cu-Pb-Zn Deposit Geochemical and Geophysical Signature”