Category Archives: Science

Low Carbon Policy to Harm Global Forests

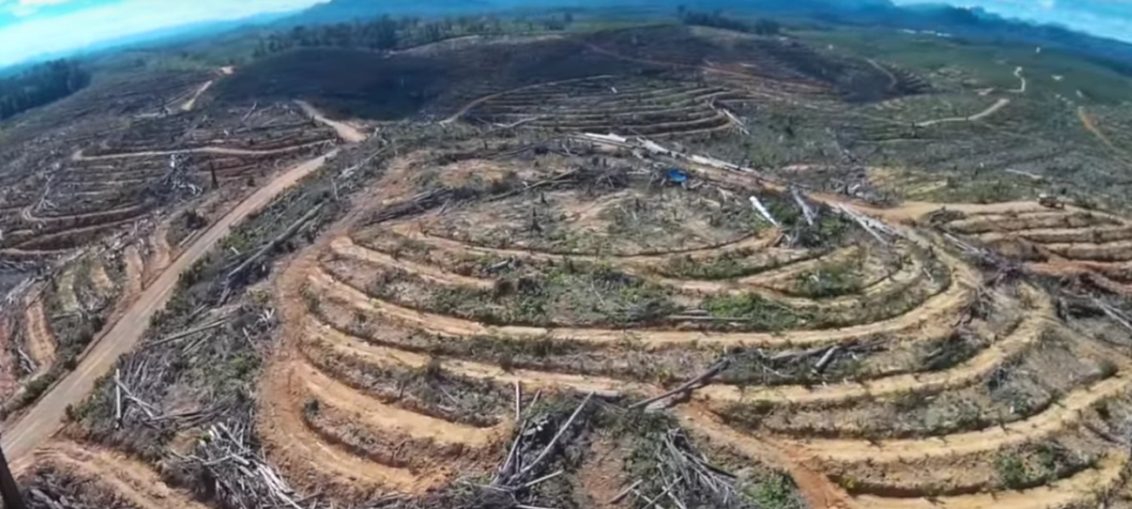
Europe’s decision to promote the use of wood as a “renewable fuel” will likely greatly increase Europe’s greenhouse gas emissions and cause severe harm to the world’s forests, according to a new comment paper published in Nature Communications. The authors posit that this new directive “will lead to a vast new cutting of the world’s forests” as additional wood equal to all of Europe’s existing wood harvests will be needed just to supply 5 percent of Europe’s energy.

Forest clearing: Hamilton Urban Forest Coalition. http://tinyurl.com/y7x8sgxg

European officials agreed on final language for a renewable energy directive earlier this summer that will almost double Europe’s use of renewable energy by 2030. Against the advice of 800 scientists, the directive now treats wood as a low-carbon fuel, meaning that whole trees or large portions of trees can be cut down deliberately to burn. Such uses go beyond papermaking wastes and other wood wastes, which have long been used for bioenergy.

The paper also estimates that using wood for energy will likely result in an increase of 10 to 15 percent in emissions from Europe’s energy use by 2050. This could occur by turning a 5 percent decrease in emissions required under the directive using solar energy or wind energy into a 5 to 10 percent increase by using wood.

Europe’s increased wood demand will require additional cutting in forests around the world, but the researchers explain the global impact is likely to be even greater by encouraging other countries to do the same. Already, tropical forest countries like Brazil and Indonesia have announced they, too, will try to reduce the effect of climate change by increasing their use of wood for bioenergy.

Forest clearing Indonesia, Laudato ‘si: http://tinyurl.com/y8u7ftjv

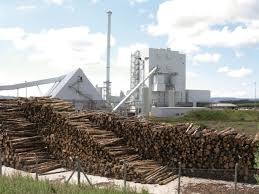
Although wood is renewable, cutting down and burning wood for energy increases carbon in the atmosphere for decades to hundreds of years depending on a number of factors, the researchers explained. Bioenergy use in this form takes carbon that would otherwise remain stored in a forest and puts it into the atmosphere. Because of various inefficiencies in both the harvesting and burning process, the result is that far more carbon is emitted up smokestacks and into the air per kilowatt hour of electricity or heat than burning fossil fuels, the authors explained.

While regrowing trees can eventually reabsorb the carbon, they do so slowly and, for years, may not absorb more carbon than the original forests would have continued to absorb. This results in long periods of time before bioenergy pays off the “carbon debt” of burning wood compared to fossil fuels.

The paper also explains why the European directive’s sustainability conditions would have little consequence. Even if trees are cut down “sustainably,” that does not make the wood carbon free or low carbon because of added carbon in the atmosphere for such long periods of time.

The directive also misapplies accounting rules for bioenergy originally created for the U.N. Framework Convention Climate Change(UNFCCC). Under the rules of that treaty, countries that burn wood for energy can ignore emissions, but countries where the trees were chopped must count the carbon lost from the forest. Although this rule allows countries switching from coal to wood to ignore true emissions figures, it balances out global accounting, which is the sole purpose of those rules, and does not make bioenergy carbon free.

Stephen Croft Wood fired Power Station. The plant is fuelled entirely by biomass material. Over 480,000 tonnes of fuel is needed to power the station every year. http://tinyurl.com/y7rg3oq4

The system does not work for national energy laws, which will be required by the directive. If power plants have strong incentives to switch from coal to carbon-neutral wood, they will burn wood regardless of any real environmental consequences. Even if countries supplying the wood report emissions through UNFCCC, those emissions are not the power plants’ problem.

Finally, the paper highlights how the policy undermines years of efforts to save trees by recycling used paper instead of burning it for energy. Also, as the prices companies are required to pay for emitting carbon dioxide increases over time, the incorrect accounting of forest biomass Europe has adopted will make it more profitable to cut down trees to burn.

Original Research

This comment raises concerns regarding the way in which a new European directive, aimed at reaching higher renewable energy targets, treats wood harvested directly for bioenergy use as a carbon-free fuel. The result could consume quantities of wood equal to all Europe’s wood harvests, greatly increase carbon in the air for decades, and set a dangerous global example.

In January of this year, even as the Parliament of the European Union admirably voted to double Europe’s 2015 renewable energy levels by 2030, it also voted to allow countries, power plants and factories to claim that cutting down trees just to burn them for energy fully qualifies as low-carbon, renewable energy. It did so against the written advice of almost 800 scientists that this policy would accelerate climate change1. This Renewable Energy Directive (RED) is now finalized. Because meeting a small quantity of Europe’s energy use requires a large quantity of wood, and because of the example it sets for the world, the RED profoundly threatens the world’s forests.

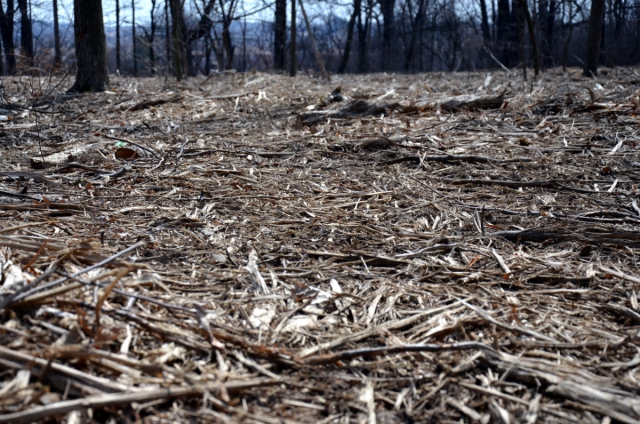
Makers of wood products have for decades generated electricity and heat from wood process wastes, which still supply the bulk of Europe’s forest-based bioenergy2,3. Although burning these wastes emits carbon dioxide, it benefits the climate because the wastes would quickly decompose and release their carbon anyway. Yet nearly all such wastes have long been used4.

Over the last decade, however, due to similar flaws in the 2008 RED, Europe has expanded its use of wood harvested to burn directly for energy, much from U.S. and Canadian forests in the form of wood pellets. Contrary to repeated claims, almost 90% of these wood pellets come from the main stems of trees, mostly of pulpwood quality, or from sawdust otherwise used for wood products5.

Comments from the Authors

Tim Beringer, Humboldt-Universität zu Berlin
“The directive reverses the global strategy of trying to subsidize countries to protect their forests and their carbon. Instead of rewarding countries and landowners to preserve forests and the carbon they store, this directive encourages companies to pay them for the carbon in their forests, but only on the condition that they cut the trees down and ship them to Europe to be burned.” 

Bjart Holtsmark, Statistics Norway
“Although the directive encourages countries to harvest wood to burn, it does not require that they do. Countries should follow alternative strategies, focusing on solar in meeting European requirements for more renewable energy.”

Dan Kammen, University of California-Berkeley 
“Compared with the vast majority of what counts as ‘bioenergy by harvesting wood,’ solar and wind have large advantages in land-use efficiency and lower and lower and lower costs. The focus on wood is not only counterproductive for climate change but unnecessary.” 

Eric Lambin, Stanford University and Université catholique de Louvain
“Treating wood as a carbon-neutral fuel is a simple policy decision with complex cascading effects on forest use, energy systems, wood trade and biodiversity worldwide. Clearly, many of these effects have not received due attention.”

Wolfgang Lucht, Potsdam Institute for Climate Impact Research and Humboldt-Universität zu Berlin
“It makes no sense at all to save trees through recycling and then turn around to burn them for energy. There is nothing green, renewable, or environmentally friendly about that. Global forests are not disposable. The European Union should wake up and limit the role of bioenergy in the transition to renewable energies.”

Peter Raven, Missouri Botanical Society
“Any increased demand for wood as fuel will have huge negative impacts on global biodiversity because many kinds of forests throughout the world, including the most biodiverse, will also end up being cut to satisfy the endless demand locally and to send to rich countries as they exhaust their own managed forests.”

Jean-Pascal van Ypersele, Université catholique de Louvain
“European citizens once more experienced the harsh effects of global warming this summer. In the name of reversing climate change, this counterproductive policy will increase deforestation and carbon emissions rather than contribute to decreasing them. More emissions will only make the summers even hotter for decades to centuries.”

Before the Big Bang & Conformal Cyclic Cosmology

What was there before the Big Bang?  This is one of the most perplexing contemplations in physics and astronomy.  There are number of theories to glimpse this distant past, however data is likely very scant, but maybe them is evidence of a prior universe in clear sight.

Here is a series of quite remarkable videos to help you contemplate what went before, before the oldest observable photons, 13.5 GA.

While I strongly recommend that you simply watch these videos in series, the last in the series is likely the most remarkable and my opening comments alluded to this.

Conformal Cyclic Cosmology(CCC) is a scheme whereby the universe is seen to be cyclic even though it never recollapse and bounces back out. Instead it undergoes whats called a conformal rescaling. What’s that ? Watch the film, all will be explained. CCC promises to solve many deep mysteries in cosmology such as why was the entropy of the big bang so low? What happened before the big bang? Where does the dark matter in our universe come from? This film addresses both the theory of CCC and the possibility of experimental verification.

Below you will recognise the image of the Cosmic Background Radiation gathered from the COBE Satellite over a  9 year period.

NINE YEAR MICROWAVE SKY http://map.gsfc.nasa.gov/media/121238/index.html Nine Year Microwave Sky The detailed, all-sky picture of the infant universe created from nine years of WMAP data. The image reveals 13.77 billion year old temperature fluctuations (shown as color differences) that correspond to the seeds that grew to become the galaxies. The signal from our galaxy was subtracted using the multi-frequency data. This image shows a temperature range of ± 200 microKelvin. Credit: NASA / WMAP Science Team WMAP # 121238 Image Caption 9 year WMAP image of background cosmic radiation (2012)

While much was made of the homogeneity of the data and the implications of this there are obvious patters in the data and various researchers have found concentric low variance circles in the CMB as can be seen in the image below.

Concentric low variance circles in the CMB data, Adam DeAbreua et al, Journal of Cosmology and Astroparticle Physics

Penrose and Meisner suggest that Conformal Cyclic Cosmology implies that these structures are the product of the collision of supermassive black holes which occurred towards the end (or indeed the infinity) of an earlier universe.  This is a most remarkable suggestion.  In a future universe a similar pattern may be all that is residual from our universe. Conformal Rescaling of gravity at the scale of the singularity could reconcile gravity and quantum mechanics.

Enjoy, I most certainly have.

Jupiter Has Two Magnetic South Poles

Jupiter as seen from the Juno spacecraft.
NASA/JPL-Caltech/SwRI/MSSS/Gabriel Fiset

A complex dynamo inferred from the hemispheric dichotomy of Jupiter’s magnetic field

The Juno spacecraft, which is in a polar orbit around Jupiter, is providing direct measurements of the planet’s magnetic field close to its surface. A recent analysis of observations of Jupiter’s magnetic field from eight (of the first nine) Juno orbits has provided a spherical-harmonic reference model (JRM09) of Jupiter’s magnetic field outside the planet.

The non-dipolar nature of the magnetic field in the northern hemisphere and the dipolar nature in the southern hemisphere is apparent. The equatorial view is centred near the Great Blue Spot and shows the linkage of magnetic field lines that enter through the Great Blue Spot. The contoured surface on which the field lines shown start and end is at r = 0.85RJ, where the density of field lines is proportional to the radial magnetic field strength and is depicted by the colour scale (red outward flux, blue inward flux).

This model is of particular interest for understanding processes in Jupiter’s magnetosphere, but to study the field within the planet and thus the dynamo mechanism that is responsible for generating Jupiter’s main magnetic field, alternative models are preferred.

The authors report maps of the magnetic field at a range of depths within Jupiter. They find that Jupiter’s magnetic field is different from all other known planetary magnetic fields. Within Jupiter, most of the flux emerges from the dynamo region in a narrow band in the northern hemisphere, some of which returns through an intense, isolated flux patch near the equator. Elsewhere, the field is much weaker. The non-dipolar part of the field is confined almost entirely to the northern hemisphere, so there the field is strongly non-dipolar and in the southern hemisphere it is predominantly dipolar. The authors that Jupiter’s dynamo, unlike Earth’s, does not operate in a thick, homogeneous shell, and we propose that this unexpected field morphology arises from radial variations, possibly including layering, in density or electrical conductivity, or both.

Original Research

Full Text

Truely Breathtaking – Saturn’s moon Dione

Saturn’s moon Dione hangs in front of Saturn’s rings in this view taken by NASA’s Cassini spacecraft during the inbound leg of its last close flyby of the icy moon. North on Dione is up. The image was acquired in visible light with the Cassini spacecraft narrow-angle camera on 17 August 2015. The view was acquired at a distance of approximately 98,000 miles (158,000 kilometres) from Dione and at a sun-Dione-spacecraft, or phase, angle of 35 degrees. Image scale is 3,100 feet (950 metres) per pixel. Image credit: NASA/JPL-Caltech/Space Science Institute.

This spectacular image of Dione and Saturn’s rings is simply fantastic.  Dione is a small moon with a diameter of 1,120 km, surface gravity of 0.232 m/S2 and semi-major axis similar to that of Earth’s moon.  Its orbital period is only 2.7 days however, 10% of our moon, reflecting the Saturn’s greater mass (95 times that of Earth).

First detection of complex organics on an extraterrestrial water-world

200 AMU macromolecular organics detected in plumes on Enceladus

Cassini was intentionally crashed into the atmosphere of Saturn late in 2016, to avoid contamination of any of the moons of the planet.  While that ended data collection from Saturn and its moons, data analysis continues to produce surprises.  Saturn’s moon Enceladus harbours a global ocean beneath an icy crust and above a  rocky core.

Icey crust of Enceladus showing evidence of recent active “tectonism” and an absence of impact structures over large portions of the moon.  Source NASA/JPL

A surprising discovery in 2005 which initiated widespread debate on the potential of Enceladus to harbour life was the observation of active cryo-volcanic plumes ejecting ice and vapour into space.   It was conjectured that hydrothermal activity in the core of the moon was powered by tidal dissipation produced by the strong gravitational field of Saturn.  Studies of the plume in a close fly-by by Cassini revealed the present of simple organic molecules mostly below 50 Atomic Mass Units (AMUs).  In a new study just published in Nature, Frank Postberg et al report the observation of emitted ice grains containing organic material with molecular mass above 200 AMU, complex macromolecular organic matter.

Complimentary Full Text

Plumes From Saturn’s Moon Enceladus Hint That It Could Support Life. Source: CreditNASA/JPL-Caltech, via Space Science Institute

Two mass spectrometers onboard Cassini, the Cosmic Dust Analyser and the Ion and Neutral Mass Spectrometer performed compositional in-situ measurements of material emerging from the surface of Enceladus, both within the plume and Saturn’s E-ring.  the E-ring has been formed by ice grains escaping the moon’s gravity.

The organic fragments, of up to 200 units of molecular mass, are created as the ice grains hit the dust-analysing instrument on Cassini at speeds of about 30 000 kilometres per hour, but the researchers believe that, prior to the collision, the grains contain the original, even larger molecules, which could have molecular weights of thousands of atomic mass units.

Scientists calculate molecular mass, or weight, as the sum of weights of individual atoms contained in the molecule. Previously, Cassini had only detected lightweight organic molecules at Enceladus that were much smaller than the most recently found fragments.

Such large molecules can only be created by complex chemical processes – including those related to life. Alternatively, they could come from primordial material as found in some meteorites or, more likely, be generated by hydrothermal activity.

The authors suggest the presence of a refractory organic rich film at the top of the oceanic water table as the most plausible way to generate the observed grains.  They suggest that this insoluble organic layer would exist at the top of the water layer likely at the base and within the large cracks evident on the surface of the moon.

This discovery is the first ever detection of complex organics on an extraterrestrial body.  In an European space Agency press release, Frank Postberg commented:

“It is the first ever detection of complex organics coming from an extraterrestrial water-world.  We found large molecular fragments that show structures typical for very complex organic molecules. These huge molecules contain a complex network often built from hundreds of atoms of carbon, hydrogen, oxygen and likely nitrogen that form ring-shaped and chain-like substructures.”

“In my opinion the fragments we found are of hydrothermal origin, having been processed inside the hydrothermally active core of Enceladus: in the high pressures and warm temperatures we expect there, it is possible that complex organic molecules can arise,” says Frank.

Be very happy –  it happened in your lifetime.

Macromolecular organic compounds from the depths of Enceladus

Frank Postberg,  Nozair KhawajaBernd AbelGael ChobletChristopher R. GleinMurthy S. GudipatiBryana L. HendersonHsiang-Wen HsuSascha KempfFabian KlennerGeorg Moragas-KlostermeyerBrian MageeLenz NölleMark PerryRené ReviolJürgen SchmidtRalf SramaFerdinand StolzGabriel TobieMario Trieloff & J. Hunter Waite

Abstract

Saturn’s moon Enceladus harbours a global water ocean1, which lies under an ice crust and above a rocky core2. Through warm cracks in the crust3 a cryo-volcanic plume ejects ice grains and vapour into space4,5,6,7 that contain materials originating from the ocean8,9. Hydrothermal activity is suspected to occur deep inside the porous core10,11,12, powered by tidal dissipation13. So far, only simple organic compounds with molecular masses mostly below 50 atomic mass units have been observed in plume material6,14,15. Here we report observations of emitted ice grains containing concentrated and complex macromolecular organic material with molecular masses above 200 atomic mass units. The data constrain the macromolecular structure of organics detected in the ice grains and suggest the presence of a thin organic-rich film on top of the oceanic water table, where organic nucleation cores generated by the bursting of bubbles allow the probing of Enceladus’ organic inventory in enhanced concentrations.

complimentary Full Text


Solar Activity remains subdued – with the chance of a C-Class Flare. Surface Temp remain at 5778K – largely unchanged for the last 100 Million Years.

Face of the sun 20170324 – Courtesy NASA and the SOHO Mission: https://sohowww.nascom.nasa.gov/sunspots/

“Analysis of Solar Active Regions and Activity from 22/2100Z to 23/2100Z: Solar activity has been at very low levels for the past 24 hours. There are currently 1 numbered sunspot regions on the disk.
IB. Solar Activity Forecast: Solar activity is expected to be very low with a slight chance for a C-class flare on days one, two, and three (24 Mar, 25 Mar, 26 Mar)”

The continues to show little sunspot activity and is very quiet as we enter the solar minimum.

Sun Spot Number Progression during solar cycles 23 and 24 Courtesy NASA: http://www.swpc.noaa.gov/products/solar-cycle-progression


Could we now be entering the period prior to the Maunder Minimum cold period

Solar Cycles 3 through 6 compared with Solar Cycles 23 through 24 Courtesy: https://wattsupwiththat.com/2013/03/05/how-long-to-the-2425-solar-minimum/


Solar  cycles 22 and 23 are show very similar trends to SC 03 and 04 which receded a 70 year period when there were no reported sunspots resulting in reduced insolation and a very cold period in northern europe.

A Very Quiet Sun

Solar Disk 20160704 – Very Quiet with no numbered sun spots on the face

As we come off the Solar Maximum the sun continues to show very low levels of activity.  For months solar activity has been at very low levels despite being at solar max.  Currently there are no numbered sunspots on the disk and activity is expected to remain at these levels for the coming few days (the limit of forecast capability).  The geomagnetic field is also at low levels and solar winds peaked at 593 km/sec at 03/0341Z.  As we head into what could be the quietest solar minimum in several hundred years the impact on climate will be very interesting.

International sunspot number Sn, with last 13 years and forecasts

Given the hiatus in global temperatures in the last 20 years plus the onset of La Nina Pacific Ocean cooling event, the coming Northern Winter could be a cold one.  Given that we are at the peak of the warming cycle,  we could well be close to the terminal phase prior to a significant decrease in global temperatures.  Will the coincidence of La Nina and weak Solar Minimum prove to be a tipping point in global climate.  Given the current orientation of the earth, this would seem quite likely in coming few years.

Reference Sites:

Stalagmite Research in the SW Pacific Highlights the complexity of Global Climate

Stalagmite Research in the SW Pacific Highlights the complexity of Global Climate

Interesting research published in Nature communications comments on the global warming pause, the Little Ice Age impacts in the Pacific and the over simplicity of climate models.  The stalagmites used in this study (LR06-B1 and LR06-B3) were collected from Liang Luar, an ~1.7-km-long cave situated on the east Indonesian island of Flores (8° 32’N, 120° 26’E; 550m above sea level.  They used U/Th dating, 18O and 13C isotope profiles, trace element analysis, principle component analysis and GCMs to conclude that:

  • “from the beginning of this century until recently, the tropical Pacific was locked into a negative Interdecadal Pacific Oscillation phase (that is, low-frequency La Niña-like pattern) in association with increased Walker and Hadley circulation winds and eastern Pacific cooling”
  • “The La Niña-like pattern is thought to be a factor contributing to the recent so-called ‘warming hiatus and earlier twentieth century cool and warm decades”.
  • “Therefore, our analysis of multi-century hydroclimate variability suggests that projections of tropical rainfall patterns, and global temperature extremes, will remain uncertain until paleoclimate records and models consistently capture the lower-frequency variability, and associated feedbacks, in the tropical Pacific”.

Importantly, in this data there is clear evidence that the dry period evident around the turn of the last millennium coincides with the approximate timing of the Medieval Climate Anomaly ~950–1250 CE seen in Europe.    The Little Ice Age event (widely thought to have been a largely European event) can be seen in this data with a ~400-year reduction in AISM rainfall recovering in strength at around 1300, and by 1500 is above average –  coincident with the Little Ice Age. Maximum rainfall in Flores at ~1600 CE, amongst the wettest periods of the past 2,000 years, is synchronous (within dating uncertainty) with peak cooling in the Northern Hemisphere and maximum ice discharge in the North Atlantic.  This is solid evidence for the global nature of the MCA and LIA.

Abstract

Interdecadal modes of tropical Pacific ocean-atmosphere circulation have a strong influence on global temperature, yet the extent to which these phenomena influence global climate on multi century timescales is still poorly known. Here we present a 2,000-year, multiproxy reconstruction of western Pacific hydroclimate from two speleothem records for southeastern Indonesia. The composite record shows pronounced shifts in monsoon rainfall that are antiphased with precipitation records for East Asia and the central-eastern equatorial Pacific. These meridional and zonal patterns are best explained by a poleward expansion of the Australasian Intertropical Convergence Zone and weakening of the Pacific Walker circulation (PWC) between ~1000 and 1500 CE Conversely, an equatorward contraction of the Intertropical Convergence Zone and strengthened PWC occurred between ~1500 and 1900 CE. Our findings, together with climate model simulations, highlight the likelihood that century-scale variations in tropical Pacific climate modes can significantly modulate radiatively forced shifts in global temperature.

Original Research Paper:  Read Here

Download PDF: Here

Climate and Sea Level – Regular Dramatic Change over 1.2 Ma

As  can be seen in the above graphic,  isotopic data derived from ice-cores, deep-sea sediment sediments and other proxies shows dramatic and a characteristic “saw-tooth” signature over the Pleistocene  (1.2 million years).

For a compilation of the same oxygen isotope and other data over the last 2.7 million years (which shows the same repetitive saw tooth change in climate/temperature proxies) see the image below:

Global chronostratigraphical correlation table for the last 2.7 million years.  High Resolution Image

This data shows very clearly that longer periods of slow cooling are followed (or preceded!) by dramatic periods of warming.  The current warming period commenced well before recent industrialisation and consistent with the trend and the satellite temperature data would now seem to be at or close to its peak.  Is it any wonder that humanity has prospered during this warming period.

This data suggests that we should expect a slow cooling in the near future and the implications  of that for humanity will be serious with declines in crop production and likely population unless we have averted the catastrophic impacts through CO2 emissions.

Fossil fuel usage saved the earth from the ravage of a growing population in the past and it is possible that it is now saving humanity from the next ice-age that is if the miniscule contribution of humanity to planet wide CO2 production is having any meaningful impact.

Original Research:  

No Ordinary Rock

Looks like any old rock –  but this is no ordinary rock, its on the surface of Mars.

This rock was photographed a couple of days ago using the Mars Hand Lens Imager (MAHLI) on NASA’s Curiosity Mars rover. Curiosity has now been operational on Mars for 1, 282 days.

The unassuming rock in the center of this image consists of laminated sandstone with small nodules  and is 2 cms across.  Weathered nodules litter the ground around the rock.

This nodule is about one inch (two centimeters) across. It appears within the composite image below in the left foreground.  The image was taken on a Sol 1276 view  from Curiosity Mast Camera.

Panoramic image from the Mast Camera.  The rock above is from the left of the image.  The image field is around 2×1.5 metres.  More Detail.

Patches of Martian sandstone visible in the lower-left and upper portions of this view from the Mast Camera of NASA’s Curiosity Mars rover have a knobbly texture due to nodules apparently more resistant to erosion than the host rock in which some are still embedded.

The site is at a zone on lower Mount Sharp where mudstone of the Murray geological unit — visible in the lower right corner here — is exposed adjacent to the overlying Stimson unit. The exact contact between Murray and Stimson here is covered with windblown sand. Most other portions of the Stimson unit investigated by Curiosity have not shown erosion-resistant nodules. Curiosity encountered this unusually textured exposure on the rover’s approach to the “Naukluft Plateau.”

Just for a little perspective, while we view the geology on another plant, its a little more than 100 years since we first flew in the air!

More information on the Image is available here.