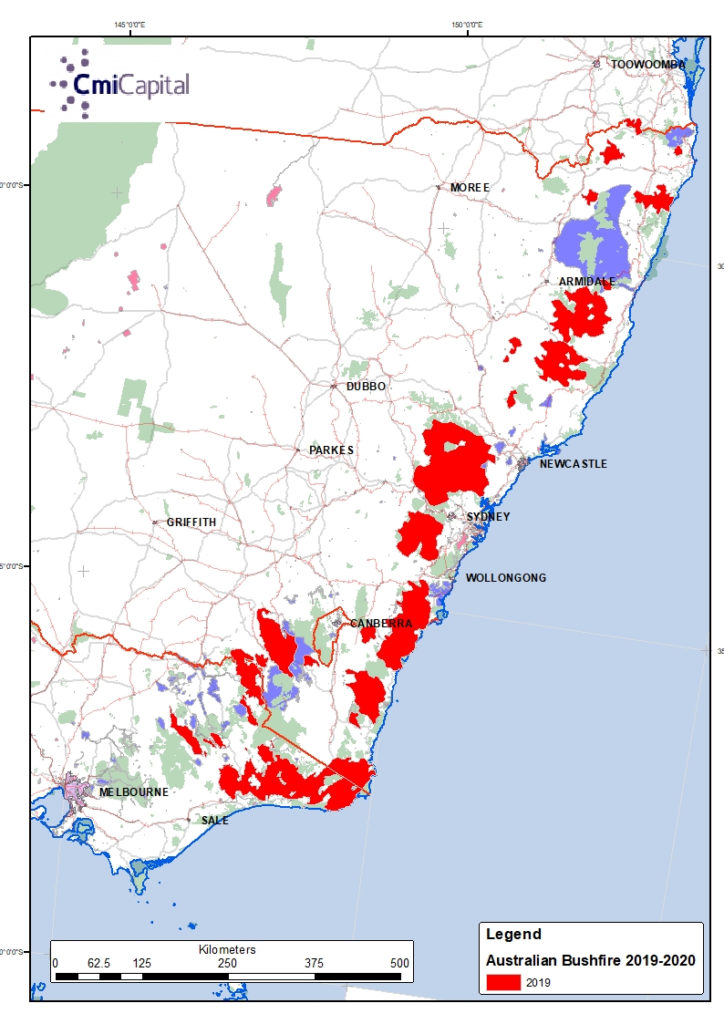
The bushfire drama in Australia has subsided for the moment so now is a good time to take stock. As of 7/1/2020, the bushfires have devastated an area in Victoria and New South Wales of 49,600 km2. In eastern Victoria the total burnt area was 12,100 km2 while in New South Wales it was 37,500km2.
Various media outlets have been reporting more than 100,000 km2 was impacted by bushfires in eastern Australia which is a significant and entirely unnecessary exaggeration.
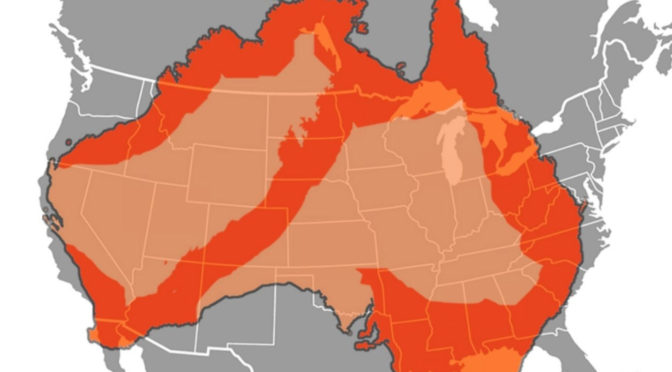
The prize for journalistic deceit however goes to Matt Zarrel of US, ABC News where he breathlessly shows a map of Australia superimposed on the USA. The extent of the fires shown on this map (see below) totals 3.6 million km2, slightly less than half of the surface area of the continent or 60 times larger than the reality. I doubt that anyone can be surprised.
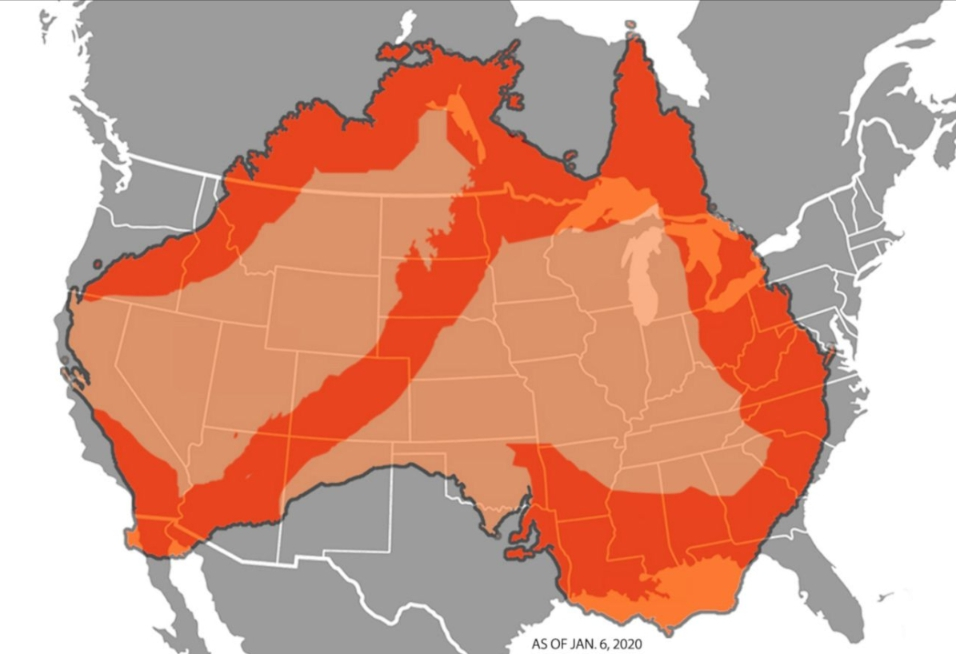
ABC news was so embarrassed by the gross exaggeration they removed the graphic.
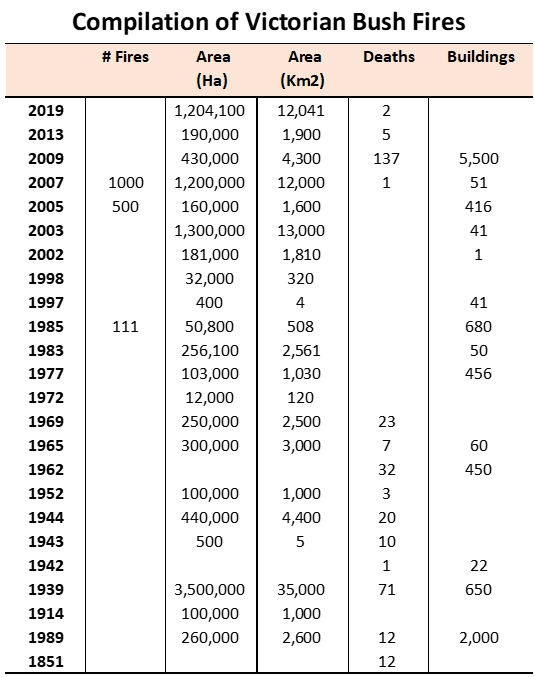
While the Australian Bushfires in 2019-2020 have been widespread it is worth noting that such events in Australia are not uncommon as can be seen for the tabulation below for the state of Victoria. The fires of 1939 covered 35,000 km2, a significant multiple to the 2019-2020 fires which were more comparable in scale to the 2003 and 2007 events.